
Infrastructure Finance for the Public Good: How Asset Recycling Can Untangle the New York MTA’s $50 Billion Debt Load
Systematic infrastructure underinvestment – a $2.6 trillion ‘gap’ – and accelerating climate change have become facts of life in the United States. Though typically attributed to politics, this Article posits the circumstances as a market disequilibrium rooted in an interplay between unique dimensions of infrastructure and distinctive features of the U.S. approach. Legislative action, including the Infrastructure Investment and Jobs Act, is insufficient to overcome these long-standing challenges.
Based on a broad, global study of effective approaches to infrastructure finance, as well as a multi-disciplinary analysis of the economics, engineering and finance literature, this Article proposes addressing the U.S. infrastructure disequilibrium through asset recycling. Asset recycling is an innovative strategy, pioneered in Australia, premised on: (i) monetizing existing, government-owned infrastructure; and (ii) reinvesting the proceeds in development of new assets, which can be ‘recycled’ again, creating a virtuous cycle on a debt-neutral basis.
The Article illustrates this approach through a detailed, empirical case study of the New York MTA, the nation’s largest transit agency. The MTA has over $50 billion of debt, COVID-19-related losses exceeding $20 billion and bond covenants, as well as state law explicitly prohibiting bankruptcy. The analysis finds that monetizing solely the MTA’s bridge and tunnel assets (but not the subway) through a long-term concession could, conservatively, generate $33 to $53 billion – sufficient to repay the majority, if not entirety, of the MTA’s obligations, giving it the wherewithal to build the sustainable infrastructure that New York deserves.
Beyond the mechanics and empirics, the underlying principles – leveraging private capital, coupled with robust oversight – have far broader implications, as asset recycling is estimated to represent a $1.1 trillion opportunity. The Article concludes with a discussion of normative and policy considerations, as well as areas for future research, including multi-stakeholder governance frameworks for imperfect public goods, ESG-based contractual mechanisms and the interplay between infrastructure policy and climate change, with an emphasis on broad-based social and allocative equity.
Introduction
“If I…took you to LaGuardia Airport in New York, you must think I must be in some third world country,” President Joe Biden once observed upon entering the financial capital of the world’s largest economy.1Marc Santora, Some See Biden’s ‘Third World’ Description of La Guardia as Too Kind, N.Y. Times (Feb. 7, 2014), https://www.nytimes.com/2014/02/08/nyregion/some-see-third-world-as-too-kind-for-la-guardia.html [https://perma.cc/4THK-GSSA]; cf. Dana Varinsky, Donald Trump Called LaGuardia Airport ‘Third World’—Here’s the Design That Will Transform It, Bus. Insider (Sept. 27, 2016, 2:12 PM), https://www.businessinsider.com/trump-laguardia-airport-redesign-2016-9 [https://perma.cc/5YXT-2MRV]. But see infra notes 125-32 and accompanying text (describing public-private partnerships to revitalize LaGuardia and JFK airports).
According to a recent Council on Foreign Relations report, “U.S. infrastructure is both dangerously overstretched and lagging behind that of its economic competitors, particularly China.”2James McBride et al., The State of U.S. Infrastructure, Council on Foreign Rels. (Sept. 20, 2023, 11:30 AM), https://www.cfr.org/backgrounder/state-us-infrastructure [https://perma.cc/6KV5-97FH] (hereinafter, “State of U.S. Infrastructure”).
With a perplexing enthusiasm, the American Society of Civil Engineers determined that “[f]or the first time in 20 years, our infrastructure GPA is a C-, up from a D+,” with a $2.6 trillion ‘investment gap.’3 Am. Soc’y of Civ. Eng’rs, 2021 Report Card for America’s Infrastructure (n.d.), https://infrastructurereportcard.org/wp-content/uploads/2020/12/National_IRC_2021-report.pdf [https://perma.cc/6YRQ-UXNQ].
Recent legislative efforts, including the 2021 Infrastructure Investment and Jobs Act (“IIJA” or “2021 Infrastructure Act”) and subsequent legislation, offer a starting point but are unlikely sufficient to comprehensively address the problems.4Infrastructure Investment and Jobs Act, Pub. L. No. 117–58, 135 Stat. 429 (2021).
Policy is conceptualized broadly but experienced locally. Roads, public transit, water and electricity have an extraordinary impact on our quality of life. However, we don’t think much about those things unless they stop working.
The socio-economic importance of infrastructure, and the United States’ chronic underinvestment and neglect toward it, have been thoroughly documented in the economics and engineering literature as well as the media.5See supra notes 1-3; see also infra notes 9-12, 39-41, 96, 177-78 and accompanying text.
However, these issues have been surprisingly under-researched in the legal scholarship.
This Article aims to bridge that gap through a multi-disciplinary, empirical approach, coupled with a global perspective. It is organized in four parts.
Part I introduces the salient problem – the ‘market’ for infrastructure finance is persistently broken, impairing our economy, quality of life and ability to address climate change – and analyzes the underlying causes. The Article posits that the disequilibrium goes beyond politics, driven by a combination of infrastructure’s unique economic attributes, and exacerbated by distinctive features of the U.S. approach. Though the U.S. typically views itself as private sector-centric, it takes a meaningfully different approach with respect to infrastructure – emphasizing a government-provision model with a federalist delegation of responsibility to the state level, where the majority of infrastructure spending occurs.6See infra Part I.B.3.
In contrast, other countries have over time incorporated more private sector involvement, adopting ‘hybrid’ models to drive better outcomes – and illustrating the range of options. Based on that holistic, global framework, Part I previews the core proposal: asset recycling.
Asset recycling is an innovative strategy, pioneered in Australia, premised on a two-phase process: (i) transitioning existing, mature infrastructure assets to a public-private-partnership (but not a privatization); and (ii) using the proceeds to finance new projects. As a result, the government develops more infrastructure on a debt-neutral basis. The potential value creation is estimated to exceed $1.1 trillion.7See infra notes 109-10.
In contrast, the IIJA will fill only 18.2% to 22.4% of the infrastructure ‘investment gap.’8For a detailed analysis, see Lev E. Breydo, Inequitable Infrastructure: An Empirical Assessment of Federalism, Climate Change and Environmental Racism, 102 N.C. L. Rev. 1035, 1041 (2024).
Parts II and III contextualize and quantify these issues through a comprehensive, multi-disciplinary case study of the New York Metropolitan Transportation Authority (“MTA”), leveraging the legal, financial, economic and engineering literatures.9See Edward Glaeser & James Poterba, Economic Perspectives on Infrastructure Investment 6 (2021), https://www.economicstrategygroup.org/wp-content/uploads/2021/07/GlaeserPoterba_071421.pdf [https://perma.cc/K4F4-VKGT] (observing a “collision of paradigms” between engineering and economics with respect to infrastructure, noting that “[u]nlike engineers, who are often asked what it will cost to build a bridge but not asked to measure its benefits, economists are rarely asked to determine the cost of a bridge” but often asked about the cost-benefit analysis).
Part II focuses on the MTA and its challenges; Part III details application of asset recycling.
The MTA was selected, in part, because the scale and acuity of its challenges – a debt load exceeding $50 billion, a long-delayed $51.5 billion climate investment program, and “no bankruptcy” bond covenants – crystalize the necessity of innovative solutions. At the same time, the MTA, in many ways, also represents a microcosm of issues plaguing infrastructure policy nationwide, including transit systems from Boston to Chicago and San Francisco burdened by eerily similar woes,10See infra notes 147 and 223.
an “increasingly unreliable” electric grid 11Katherine Blunt, America’s Power Grid Is Increasingly Unreliable, Wall St. J. (Feb. 18, 2022, 10:06 AM), https://www.wsj.com/articles/americas-power-grid-is-increasingly-unreliable-11645196772.
and failing water systems from Michigan to Mississippi.12Melissa Denchak, Flint Water Crisis: Everything You Need to Know, NRDC (Oct. 8, 2024), https://www.nrdc.org/stories/flint-water-crisis-everything-you-need-know#sec-summary [https://perma.cc/TV77-8UPL] (“In Flint, nearly 9,000 children were supplied lead-contaminated water for 18 months.”); Alyssa Lukpat, Jackson Water Crisis: Mississippi Capital Residents Have Little to No Drinking Water. Here’s Why., Wall St. J. (Aug. 31, 2022, 11:54 AM) https://www.wsj.com/articles/jackson-mississippi-water-crisis-explained-11661877514?cx_testId=3&cx_testVariant=cx_2&cx_artPos=1&mod=WTRN#cxrecs_s.
Particularly for public transit, the aftereffects of the Covid-19 pandemic have rendered dull, long-standing pain into a far more acute ailment, closer to a broken arm.
Part III empirically illustrates why a tailored asset recycling strategy presents a highly attractive avenue for addressing the MTA’s predicaments. Based on a thorough financial analysis as well as extensive market research, the Article estimates that a concession (distinct from a sale) for just the MTA’s bridge and tunnel assets could, conservatively, generate between $33 and $53 billion (and potentially up to $62 billion) in proceeds, sufficient to repay a majority, if not the entirety, of the MTA’s debt – giving it the wherewithal to invest for the future.13As discussed before, the analyses in this Article are as of late 2021 (when this research was conducted) and reflect then-prevailing market conditions and financing rates, including term structure. Correspondingly, the results of certain analyses may differ today based on evolving interest rate conditions and assumptions which are subject to change. See infra Part III for further discussion.
Part III concludes by detailing the integrative value creation from asset recycling, as well as distinctions between the proposed approach and ‘privatization,’ as the term is commonly understood. Though the empirics are MTA-specific, given similar challenges facing infrastructure nationwide, the proposal has applications and implications well beyond New York.
Part IV explores normative dimensions and policy considerations. First, it outlines key factors for implementing asset recycling, including asset selection, governance and contractual structure, with provisions tied to environmental, social and governance (“ESG”) metrics. Second, it discusses governance frameworks for imperfect public goods, such as infrastructure, finding corporate-centric approaches imprecise, and recommending application of broader multi-stakeholder models. Finally, it discusses the interplay of infrastructure and climate change, emphasizing that allocative equity and socio-economic justice must be at the heart of infrastructure policy.
I. Infrastructure Finance, Ownership & Control
Understanding the challenges facing U.S. infrastructure generally, and the MTA specifically, requires some background on how these types of assets are financed, operated and governed.
Infrastructure financing and ownership structures exhibit significant variation across jurisdictions worldwide.14McBride et al., supra note 2.
Some nations, like Australia and Japan, are relatively open to private sector involvement and investment in infrastructure. Others, particularly in Europe, take something of a middle ground. The U.S., in contrast, emphasizes public sector ownership and financing of infrastructure. However, the U.S. approach has varied over time, with the private sector previously playing a larger role – and more recently there have been growing examples of U.S. private sector involvement.15See infra Part II.C. As discussed in infra Part II.C., there is also notable heterogeneity in approach based on asset type.
The diversity of approaches illustrates a salient point: there is no ‘right’ answer,’ and more than one option.
This part of the Article sets the stage for the broader discussion. First, it introduces the salient problem – a persistent breakdown in the ‘market’ for infrastructure finance – and describes the why, focusing on distinctive aspects of the U.S. public sector-centric model. Then, it contextualizes the policy proposals through analysis of global approaches, finding increasing prevalence of ‘hybrid models.’ Finally, the discussion previews the asset recycling proposal and contrasts the associated policy dimensions with the 2021 Infrastructure Act.16Certain aspects of this discussion are reiterated, further detailed, and expanded upon in a subsequent follow-on Article. See Breydo, supra note 8, at 1042.
A. Background & Economic Foundations
The ‘market’ for infrastructure exhibits persistent disequilibria, impairing our economy, quality of life and ability to address climate change. Some of the challenges are inherent to infrastructure; others, as discussed below, are arguably exacerbated by America’s approach.
1. Taxonomy
Though a commonly used term, the definition of “infrastructure” is surprisingly complex and seemingly amorphous.17 . See Brett M. Frischmann, Infrastructure: The Social Value of Shared Resources 3-5 (2012) (defining “infrastructure resources” as “shared means to many ends.”); see also Glaeser & Poterba, supra note 9, at 185 (noting “[t]he term ‘infrastructure’ is a relatively recent addition to our national vocabulary, and its meaning has evolved over time.”); Infrastructure, Black’s Law Dictionary (11th ed. 2019) (noting “standard” definitions of infrastructure); Infrastructure, Merriam-Webster Dictionary Online, https://www.merriam-webster.com/dictionary/infrastructure [https://perma.cc/S9NZ-ZK8F] (last visited Oct. 11, 2024); William Morris & Mary Morris, Morris Dictionary of Word and Phrase Origins 309 (2d ed. 1988) (providing a historical account of how the term’s meaning has evolved).
Taxonomically, in simplest terms, it can be grouped into two categories: (i) ‘traditional’ (‘hard’ or ‘economic’) infrastructure and (ii) non-traditional (‘soft’ or ‘social’) infrastructure.18This framework reflects a ‘classical’ economic perspective. It is, by intention, simplified to present a complex issue for relatively circumscribed purposes in this Article. It excludes certain categories, like digital infrastructure, such as AWS and cloud providers (telecommunications includes the ‘hard assets’ enabling digital services, but not the services themselves). Some scholars also taxonomize infrastructure along two dimensions: (i) between economic and social, and (ii) between services (‘soft’ infrastructure) and assets (‘hard’ infrastructure); see Mark Dyer et al., Framework for Soft and Hard City Infrastructures, 172 Urb. Design & Plan. 219, 219-22 (2019).
This distinction arguably explains much of the politicized debate around the recent Infrastructure Investment and Jobs Act.19See also supra note 4. Compare Jim Tankersley & Jeanna Smialek, Biden Plan Spurs Fight over What ‘Infrastructure’ Really Means, N.Y. Times. (June 24, 2021), https://www.nytimes.com/2021/04/05/business/economy/biden-infrastructure.html, with Editorial Board, A not so Grand Infrastructure Deal, Wall St. J. (July 29, 2021, 6:47 PM), https://www.wsj.com/articles/a-not-so-grand-infrastructure-deal-senate-democrats-republicans-11627597534.
Figure 1. Infrastructure Taxonomy
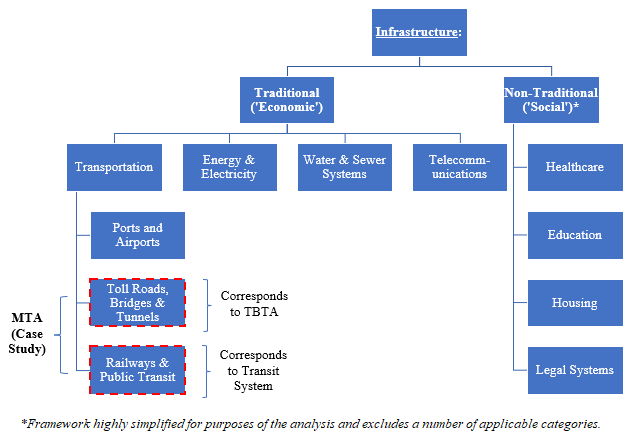
For our purposes, we can think of infrastructure as “shared means to many ends” which do not directly produce goods or services, but provide the “underlying framework” or “foundation,” facilitating processes that do.20 Frischmann, supra note 17, at 4; Jeffrey E. Fulmer, What in the World is Infrastructure?, Infra. Investor, July-Aug. 2009, at 30, 32 https://30kwe1si3or29z2y020bgbet-wpengine.netdna-ssl.com/wp-content/uploads/2018/03/what-in-the-world-is-infrastructure.pdf [https://perma.cc/TY9A-VWJD] (Defining infrastructure as “[t]he physical components of interrelated systems providing commodities and services essential to enable, sustain, or enhance societal living conditions”).
Because this Article largely focuses on economic infrastructure, and transportation specifically – with case study-specific elements denoted in Figure 121See infra Parts II, III (detailing MTA case study, as labeled).
– for the sake of relative simplicity, it will at times use the term ‘infrastructure’ to reference just those elements of the broader taxonomy.
2. An Imperfect Public Good with Externalities
Contemporary legal frameworks can (albeit, sometimes unintentionally) trend towards viewing public goods and private goods as a binary choice,22Jesse Malkin & Aaron Wildavsky, Why the Traditional Distinction Between Public and Private Goods Should Be Abandoned, 3 J. Theoretical Pol. 355 (1991); Elinor Ostrom, Beyond Markets and States: Polycentric Governance of Complex Economic Systems, 100 Am. Econ. Rev. 641 (2010).
roughly corresponding to the respective public and private law frameworks.23This is not always the case, of course. Commercial law involves both public and private law; bankruptcy, for instance, is a federal statutory framework for addressing bilateral (private) economic relationships. The interplay in commercial law, however, is distinct from this discussion, which is perhaps more akin to blending across the spheres rather than coordination amongst silos.
Accordingly, infrastructure is frequently termed a “public good,”24Professor Garrett, former Dean of Wharton, noted that “[t]he classical position on infrastructure is that it is a ‘public good’— something critical to society that ‘the market’ would undersupply — and hence the natural domain of government.” Geoffrey Garrett, What the U.S. Could Learn from Australia About Financing Infrastructure, Knowledge at Wharton (June 8, 2018), https://knowledge.wharton.upenn.edu/article/u-s-needs-embrace-private-sector-involvement-infrastructure/ [https://perma.cc/2CEB-BH6L].
the traditional economic definition of which requires that it be:25See Paul A. Samuelson, The Pure Theory of Public Expenditure, 36 Rev. Econ. & Stat. 387, 387 (1954) (defining a “collective consumption good” as “[goods] which all enjoy in common in the sense that each individual’s consumption of such a good leads to no subtractions from any other individual’s consumption of that good . . . “); see also Richard Musgrave, The Theory of Public Finance: A Study in Public Economy (1959) (incorporating non-excludability criterion); Hal R. Varian, Microeconomic Analysis (W.W. Norton & Co. 3d ed. 1992) (conceptualizing “public goods” as meeting both Samuelson’s non-rivalrous standard and Musgrave’s non-excludability criterion).
(1) ‘non-rivalrous’26“Non-rivalrous” can be broadly defined as accessible by all such that one individual’s use does not impede another’s. Perhaps the simplest example of a rivalrous good is food; once consumed, it is no longer accessible to others.
and (2) ‘non-excludable.’27“Non-Excludable” can be defined as being such that it is impossible to prevent other individuals from consuming it. See supra note 16. For further discussion, see Breydo, supra note 8, at 1045.
Yet, in reality, infrastructure28This contextualization is intended to be with respect to economic infrastructure, and particularly transit. There are of course important applicable asset-type-specific distinctions. See infra Part IV.A.
is closest to an imperfect (or impure) public good: one that satisfies the two conditions only to a certain extent, or only some of the time.29Aman A. Bara & Bidisha Chakraborty, Is Public-Private Partnership an Optimal Mode of Provision of Infrastructure?, 44 J. Econ. Dev. 97, 97, 99 (2019) (“This paper considers infrastructure as an impure public good and examines whether a public-private partnership in financing infrastructure service is optimal,” finding “that PPP model is optimal in the provision of infrastructure no matter public capital and private capital are a substitute or complementary to each other.”).
For instance, a lighthouse or road without tolls or traffic can functionally resemble a public good. Yet, that same road can also feel closer to a private good through the rivalrous impact of rush-hour traffic and exclusionary effect of tolls. The imperfect public good construct informs much of the incongruence, and, at times, inconsistency, in how society and policy makers view infrastructure.30Randall Bartlett, Is Infrastructure a Public Good? No, Sort of, and What Role for the Public and Private Sectors, Inst. Fiscal Stud. & Democracy (May 15, 2017), https://www.ifsd.ca/en/blog/last-page-blog/infrastructure-public-good [https://perma.cc/WTB2-ETPA].
Conceptualizing infrastructure as an imperfect – rather than ‘pure’ – public good supports deep government involvement but does not create a normative disconnect in respect of private sector participation or multi-stakeholder models.
Infrastructure also exhibits “externalities,” defined as second order effects on individuals not party to a transaction.31R. H. Coase, The Problem of Social Cost, 3 J. L. & Econ. 1 (1960).
Specifically, infrastructure can generate positive externalities through increased efficiency and other economic effects, and, critically for our purposes, reduce negative externalities. For instance, driving produces negative externalities through pollution, noise and congestion – indeed, the transportation sector accounts for 36% of U.S. emissions.32Brett Marohl, Today in Energy, U.S. Energy Info. Admin. (July 26, 2021), https://www.eia.gov/todayinenergy/detail.php?id=48856 [https://perma.cc/6PRB-GGMP].
Public transit – with some of the lowest carbon emissions per kilometer traveled – can provide an externality-minimizing substitute, essential for emissions goals, thus enhancing the aggregate welfare.33Which form of Transport Has the Smallest Carbon Footprint?, Our World in Data (Aug. 30, 2023), https://ourworldindata.org/travel-carbon-footprint [https://perma.cc/7AMG-VT45].
3. Market Disequilibrium
Infrastructure is essential for both economic activity and quality of life. Yet, the ‘market’ for it exhibits pervasive disequilibria.
Economists have attributed America’s brisk post-World War II growth in part to robust infrastructure investment.34David Alan Ashauer, Why is Infrastructure Important?, in Conference Series (Federal Reserve Bank of Boston) 21, 21-68 (1990).
A large-scale ‘meta study’ of 3,000 papers found an average cumulative ‘multiplier effect’ of one-point-five times,35Fiscal Multiplier Effect of Infrastructure Investment, Global Infrastructure Hub (Dec. 14, 2020), https://www.gihub.org/infrastructure-monitor/insights/fiscal-multiplier-effect-of-infrastructure-investment/ [https://perma.cc/Y5Z4-ZC5G] (finding an average 2-5 year cumulative multiplier of 1.5x, and 1.6x in recessionary environments, compared to 1.0x and 1.4x for public spending as a whole).
while other research indicates a three-times multiplier for transportation investment.36 Jeffrey Werling & Ronald Horst, Nat’l Ass’n of Manufacturers Catching Up: Greater Focus Needed to Achieve a More Competitive Infrastructure 45 (2014), https://www.ourenergypolicy.org/wp-content/uploads/2015/06/Infrastructure-Full-Report-2014.pdf [https://perma.cc/2DME-GWPQ].
Other studies have found that traffic congestion costs the U.S. up to $120 billion per year, while airport delays add up to over $35 billion annually.37See McBride et al., supra note 2; Erik Hansen, To Fix America’s Infrastructure, Start with Airports, U.S. Travel Ass’n (May 19, 2017), https://www.ustravel.org/news/fix-america%E2%80%99s-infrastructure-start-airports.
Despite the well-understood importance of infrastructure, markets, both public and private, have a hard time providing a societally optimal supply of foundational shared resources. The aforementioned U.S. ‘infrastructure funding gap’ – estimated between $2.6 and $3.8 trillion – is, in essence, a market disequilibrium.38See Am. Soc’y of Civ. Eng’rs, supra note 3, at 8 (estimating .6 trillion investment gap); Investment Forecasts for United States, Glob. Infrastructure Hub: Infrastructure Outlook, https://outlook.gihub.org/countries/United%20States [https://perma.cc/HM8B-8F99] (estimating .8 trillion U.S. investment gap in 2021).
At present, U.S. infrastructure spending as a percentage of GDP is the second lowest amongst the G20, ahead of only Mexico, resulting in by far the largest investment gap amongst G7 nations.39See McBride et al., supra note 2.
Illustrating the real-world implications, on January 28, a Pittsburgh bridge collapsed shortly before a scheduled speech by President Biden regarding the 2021 IIJA.40Campbell Robertson & Sophie Kasakove, Pittsburgh Bridge Collapses Hours Before Biden Infrastructure Visit, N.Y. Times (Jan. 28, 2022). https://www.nytimes.com/2022/01/28/us/pittsburgh-bridge-collapse-biden.html [https://perma.cc/8PQ2-4TEN].
Beyond the headlines, society experiences the consequences of this market breakdown daily through transit delays, gridlocked traffic and power outages.41See, e.g., Denchak, supra note 12 (discussing the Flint water crisis).
As the full costs of climate change are internalized, the importance of infrastructure will only grow – as will the costs of our prevailing disequilibrium, and the failure to act.42 Jonathan Woetzel et al., Will Infrastructure Bend or Break Under Climate Stress? 23 (2020), https://www.mckinsey.com/business-functions/sustainability/our-insights/will-infrastructure-bend-or-break-under-climate-stress [https://perma.cc/J6WE-Y5AR] (noting that infrastructure is essential to climate change mitigation and will “bear the brunt” of adaptation costs.); Mekala Krishnan et al., The Net-Zero Transition viii (2022), https://www.mckinsey.com/capabilities/sustainability/our-insights/the-net-zero-transition-what-it-would-cost-what-it-could-bring [https://perma.cc/X9GL-76J2] (estimating global annual cost of .2 trillion to achieve net-zero transition).
B. U.S. Approach: Public Sector-Centered Model
Though the U.S. often views itself as highly centered around free markets and private assets, it follows a markedly different approach with respect to most infrastructure. Relative to other jurisdictions, the U.S. generally places a heavier emphasis on public sector infrastructure ownership and financing.43There are notable asset-specific distinctions to this construct; specifically, water and transit are largely public sector-centric, while there is more capital in respect of the regulated utility sector.
At the same time, largely as a function of dual-federalism, the U.S. delegates this responsibility to the state and local levels, with infrastructure assets typically financed through a combination of taxes and municipal bonds.
1. Normative Underpinnings
The ‘public good’ normative construct appears to underpin much of the U.S. approach to infrastructure.44See supra Part I.A.2. Infrastructure presents a number of distinct and important dimensions, particularly in respect of frameworks regarding ownership and control. Some of the issues are previewed, infra Part IV, but comprehensively unpacking the normative layers remains an area of ongoing and future research.
Figure 3 below charts infrastructure finance against the level of private sector participation, creating a two-by-two matrix. The U.S. model in the bottom left quadrant, maps to public sector financing and control.45Though often used interchangeably, ‘funding’ and ‘financing’ have distinct meanings in the infrastructure context. ‘Financing’ refers to the party providing capital and ‘owning’ risk; ‘funding’ refers to how infrastructure will be paid for. World Bank, Public-Private Partnerships Reference Guide 21 (3d ed. 2017), https://ppp.worldbank.org/public-private-partnership/sites/ppp.worldbank.org/files/documents/PPP%20Reference%20Guide%20Version%203.pdf [https://perma.cc/5ZXH-YJA8]; Richard Abadie, The Global Forces Shaping the Future of Infrastructure 13 (2021), https://www.pwc.com/gx/en/capital-projects-infrastructure/pdf/global-infrastructure-trends.pdf [https://perma.cc/5P2N-WYXN]. Consistent with the World Bank framework, and for purposes of relative simplicity, this model views “participation” as encompassing elements of both ownership and operational control. See infra note 87.
Figure 2. Matrix: Infrastructure Risk & Control Allocation
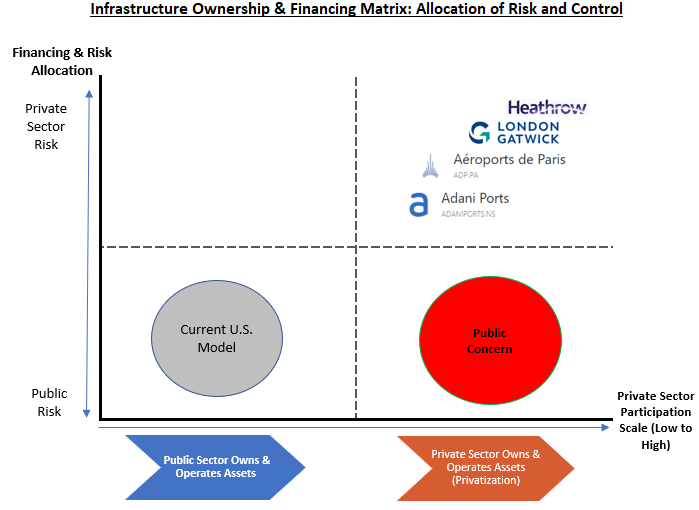
The top right quadrant maps to “privatization,” with certain private sector-owned infrastructure assets.46As discussed, for purposes of this Article, ‘privatization’ refers to the outright sale of assets, rather than hybrid models, such as public-private-partnerships. See supra Part I.C.
The bottom right quadrant reflects a common public perception regarding privatization: private gains, socialized costs.47In other words, perception of arrangements where “governments essentially guarantee . . . substantial payments” to investors, creating a “wealth transfer” at the expense of the public; see Matthew Goldstein & Patricia Cohen, DealBook, N.Y. Times (June 6, 2017), https://www.nytimes.com/2017/06/06/business/dealbook/trump-infrastructure-plan-privatized-taxpayers.html; Damon A. Silvers, Private Infrastructure Projects Are a Wealth Transfer from the Public to Wall Street, N.Y. Times, (Apr. 8, 2015, 6:47 AM), https://www.nytimes.com/roomfordebate/2015/04/08/does-the-public-benefit-from-private-infrastructure-investment/private-infrastructure-projects-are-a-wealth-transfer-from-the-public-to-wall-street [https://perma.cc/3QB4-MCUD].
The negative connotation around “privatization” is not undeserved; privatization often carries negative consequences. For instance, in 2008, Chicago ‘privatized’ certain parking assets, resulting in a significant loss to the city.48Kristin E. Schultz, Note, Public-Private Partnerships: Structuring the Revival of Fiscally Distressed Municipalities, 15 N.Y.U. J.L. & Bus. 189, 207–09 (2018) (describing Chicago transaction as “exploitation”).
Privately-run prisons have been exceptionally problematic; the Justice Department found them “more violent” than government-run institutions and recommended a “phase out.”49Timothy Williams, Inside a Private Prison: Blood, Suicide and Poorly Paid Guards, N.Y. Times (Apr. 3, 2018), https://www.nytimes.com/2018/04/03/us/mississippi-private-prison-abuse.html [https://perma.cc/8NGN-L2X5].
However, the potential harms of ‘privatization’ – while quite real and significant – need not be inherent to private sector participation. Indeed, when coupled with comprehensive oversight, certain shared resources, such as telecommunications and electricity, can be ably provided by private operators.
2. Historical Context
Infrastructure ownership and financing structures in the U.S. have gone through multiple phases – briefly public, then private, and, for the last century, public again – underscoring that our contemporary conceptualization is not the only approach.
The history of U.S. infrastructure development displays something of a dissonance, underscored by “[t]wo sets of broad and at times conflicting ideas”50Charles Jacobsen & Joel Tarr, Ownership and Financing of Infrastructure: Historical Perspective (English) 4 (World Bank Grp., Working Paper No. 1466, 1995), http://documents.worldbank.org/curated/en/624581468765619582/Ownership-and-financing-of-infrastructure-historical-perspective [https://perma.cc/8YTL-CY4K] [hereinafter Infrastructure: Historical Perspective].
– an emphasis on maximizing “overall economic development and individual economic opportunity,”51Id.
tempered by “broad fears of irresponsible accumulations of either political or economic power.” 52Id.; Charles W. Calomiris & Stephen H. Haber, Fragile By Design: The Political Origins of Banking Crises and Scarce Credit, 153–202 (2014) (discussing historical U.S. concerns about concentrations of power as a reason for relative industry and regulatory fragmentation in the U.S. banking sector).
In simplified terms53This framework does not (or intend to) capture the complex history of U.S. infrastructure or public finance but merely seeks to illustrate that the prevailing frameworks have changed over time.
, U.S. infrastructure finance – particularly for transportation and public transit – has gone through essentially three phases.54Infrastructure: Historical Perspective, supra note 50, at 8-10.
The first, in the front half of the nineteenth century, saw extensive public sector investment in infrastructure assets.55 Robert W. Poole, Jr., Asset Recycling to Rebuild America’s Infrastructure 14 (Nov. 2018), https://reason.org/wp-content/uploads/asset-recycling-rebuild-america-infrastructure.pdf [https://perma.cc/342N-RL5L].
Subsequently, depressions in 1837 and 1857 were followed by a sharp contraction in public sector capital deployment due to resource limitations.56Id.
The second phase, from the mid-nineteenth century until around the Depression era, was marked by significant private investment.57 Clifford Winston, Last Exit: Privatization and Deregulation of the U.S. Transportation System 2 (2010) (noting that “by 1860 at least 7,000 private U.S. corporations had formed to operate bridges, canals, ferries, railroads, and roads.”); U.S. Gov’t Accountability Off., GAO-08-44, Highway Public Private Partnerships: More Rigorous Up-front Analysis Could Better Secure Potential Benefits and Protect the Public Interest 11–12 (2008), https://www.gao.gov/assets/gao-08-44.pdf.
Over time, however, many of the enterprises found themselves in financial distress, oftentimes due to frictions with respect to rate-setting.
That pullback in private capital led to the third phase, in effect today, characterized by an emphasis on public authorities, rather than the private market, assuming responsibility for infrastructure, and particularly transit.58Jacobsen & Tarr, supra note 50, at 8-10.
The MTA nicely illustrates this arc of U.S. infrastructure history. The system began as two privately owned, competing lines. Subsequently, in 1932, New York City began operating a third line, which was buttressed by significant government funding and credit.59Ameena Walker, NYC Subway Cars Throughout History: from Steam-Powered Engines To Open-Gangway Design, Curbed (Sept. 20, 2017, 2:08 PM), https://ny.curbed.com/2017/9/20/16305388/nyc-subway-history-mta-train-cars [https://perma.cc/W6TE-QX8Z].
A dispute regarding fare increases followed. By 1940, NYC orchestrated a merger of the three entities. Following a transition period of relatively independent operation, the entities become more closely integrated, ultimately leading to the present-day structure.60See Part III.
The questions then were not dissimilar to those discussed today. In 1941, one scholar observed:
The administrative problems that appear where government becomes an entrepreneur and manager had indeed been present since 1932 . . . But unification raises in full force difficult questions in the adaptation of governmental concepts and procedures to the conduct of economic undertakings.61Arthur W. Macmahon, The New York City Transit System: Public Ownership, Civil Service, and Collective Bargaining, 56 Pol. Sci. Q. 161, 161 (1941) (emphasis added).
3. Federalism & Municipal Finance
Along with a public sector emphasis, a second distinctive dimension of U.S. infrastructure finance is the delegation of responsibility to the state and local levels, rather than the federal government.
This delegation reflects America’s dual-federalist framework, a constitutional construct where individual states are themselves sovereign, with powers not granted to the federal government generally reserved for the state level.62The construct is not entirely unique to the U.S. but is perhaps more pronounced. In many other nations, sub-national units of government are functionally more akin to administrative entities, with the ability to issue their own debt but generally lacking the powers of a sovereign. See U.S. Const. amend. X (“The powers not delegated to the United States by the Constitution, nor prohibited by it to the States, are reserved to the States respectively, or to the people”); Steven L. Schwarcz, Global Decentralization and the Subnational Debt Problem, 51 Duke L.J. 1179, 1179-250 (2002). As a consequence of dual-sovereignly, U.S. states are ineligible for bankruptcy, while municipal entities in respective states must be specifically authorized to utilize Chapter 9. See supra Part II.B.
As part of this division of labor, the states are traditionally responsible for providing – and financing – a range of economic63 U.S. Gov’t Accountability Off., supra note 57, at 12 (2008) (noting state responsibility to maintain highways).
and non-economic infrastructure, including police, education and healthcare.64Charles M. Tiebout, A Pure Theory of Local Expenditures, 64 J. Pol. Econ. 416, 418 (1956) (observing “Musgrave and Samuelson implicitly assume that expenditures are handled at the central government level. However, the provision of such governmental services as police and fire protection, education, hospitals, and courts does not necessarily involve federal activity. Many of these goods are provided by local governments”).
At the same time, the states retain control over land use and property laws, both of which are critical for physical asset development.65See, e.g., Joseph F. Zimmerman, National-State Relations: Cooperative Federalism in the Twentieth Century, 31 Publius 15 (2001); James R. Alexander, State Sovereignty in the Federal System: Constitutional Protections Under the Tenth and Eleventh Amendments, 16 Publius. 1(1986).
Within the states, allocation of power is further sub-divided at various levels, with public corporations often used as financing vehicles for infrastructure and other capital spending.66A significant amount of U.S. infrastructure is formally owned at the county level, including 38% of bridges. Legislative Analysis for Counties: The Bipartisan Infrastructure Law, National Association of Counties (Mar. 4, 2022), https://www.naco.org/resources/legislative-analysis-counties-bipartisan-infrastructure-law.
As a consequence, the U.S., in effect, has two relatively distinct ‘sovereign’ debt markets – the $21 trillion treasuries market, which reflects federal borrowing, and the $4 trillion municipal bond market, which reflects state and municipal entities.67The much larger U.S. Treasury market is used to fund the federal government, which may at times downstream resources to support the states, including through Covid-19 relief programs. See infra Part II.A.3.c.
About two-thirds of infrastructure projects are funded through municipal bonds issued by state and local governments; infrastructure, in turn, represents the bulk of municipal debt.68 Muni. Sec. Rulemaking Bd., Muni Facts 1 (2020), http://iabcn.org/wp-content/uploads/2020/09/MSRB-fact-sheet.pdf.
The municipal market is composed of two main instruments: (1) “full faith and credit” general obligation bonds and (2) revenue bonds, used to finance infrastructure like the MTA.69 . Sec. & Exch. Off. of Inv. Educ. & Advoc., Municipal Bonds: Understanding Credit Risk 1, https://www.sec.gov/files/municipalbondsbulletin.pdf. See infra Part II.A.2 (detailing the MTA’s revenue bond-financed capital structure).
Three features of revenue bonds are notable for our purposes.
First, the “revenue bond” structure exists because municipal entities generally cannot borrow on a ‘traditional’ secured basis,70 Juliet M. Moringiello, Municipal Capital Structure and Chapter 9 Creditor Priorities 5 (2016), https://www.brookings.edu/wp-content/uploads/2016/10/moringiello1.pdf [https://perma.cc/SKX3-KXFG] (“Creditors of private entities have recourse to the entity’s property in the event of non-payment. Creditors of public entities do not because the law considers municipal property to be held in trust for the public. Access to property is a key feature in the design of creditors’ rights laws, but municipal creditors have no rights to their debtors’ assets”).
due to difficulties of lien enforcement with respect to government property.71The basic issue is that action against governmental property can raise police power-related concerns. See David A. Skeel, Jr., What Is a Lien? Lessons from Municipal Bankruptcy, 2015 U. Ill. L. Rev. 675, 697 (2015); Moringiello, supra note 70 at 9, https://www.brookings.edu/wp-content/uploads/2016/10/moringiello1.pdf [https://perma.cc/SKX3-KXFG] (“By statute, custom, and common law, municipalities are restricted in their ability to grant security interests in other property” beyond the dedicated revenue stream, which “prohibit[s] creditors from seizing municipal assets to satisfy claims against the municipality”).
Revenue bonds bypass this challenge by granting liens in a circumscribed revenue stream – typically infrastructure, but also dedicated taxes72Lev Breydo & Sean O’Neal, Will the USVI Follow Puerto Rico’s Path?, Bond Buyer (Mar. 27, 2017, 11:17 AM), https://www.bondbuyer.com/opinion/will-the-usvi-follow-puerto-ricos-path (discussing the USVI’s tax-backed revenue bond structure). See supra Part II.A.2, discussing MTA capitalization.
— which forms the co-called “Trust Estate,” rather than in the revenue-producing asset.73Through revenue bonds, a lender receives security in the form of a pledge of revenues – though, special revenue bonds are non-recourse debt, making the bonds payable only from the municipality’s pledged special revenues. In re Heffernan Mem’l Hosp. Dist., 202 B.R. 147 (B.A.P. 9th Cir.1996).
Revenue bonds’ cash flow function is essentially a waterfall. For instance, with respect to an infrastructure project, gross revenues from user fees might first be used to cover operating expenses, with remaining net revenue flowing to the trust estate, and then to bondholders, with any excess funds kept in reserve or used for other debt needs.74Security for special revenue bonds can be in the form of: (i) A gross pledge where the bondholders’ lien attaches to the entire revenue stream; or (ii) A net pledge, where the bondholders’ lien attaches only to the revenues that are in excess of the expense of the operation and collection. Bank of N.Y. Mellon v. Jefferson Cty. (In re Jefferson Cty.), 482 B.R. 404, 434-35 (Bankr. N.D. Ala. 2012).
Second, revenue bonds can receive special statutory protections in bankruptcy, with well-documented legal difficulties in ‘impairing,’ or reducing, such obligations, complicating infrastructure financial distress.75Special revenue bonds receive unique protections under section 922 of the bankruptcy code, and until recently those protections were understood to include collection of post-petition interest. Id. at 428-27; see also David A. Skeel Jr., Is Bankruptcy the Answer for Troubled Cities and States?, 50 Hous. L. Rev. 1063 (2013); Alexander D. Flachsbart, Municipal Bonds in Bankruptcy: §902(2) and the Proper Scope of “Special Revenues” in Chapter 9, 72 Wash. & Lee L. Rev. 955, 982 (2015) (“The first key to bondholder treatment in municipal bankruptcy is the presence or absence of property rights to municipal revenue.”).
For natural monopolies, the challenge is particularly pronounced, as it can effectively require rate increases beyond what their constituencies can afford.76For instance, some courts have required issuers to raise rates in order to repay bond obligations. See State ex rel. Allstate Insurance Co. v. Union Public Service District, 151 S.E.2d 102 (W. Va. 1966); see also Robert S. Amdurskyet al., Municipal Debt Finance Law: Theory and Practice, 336-40 (2d ed. 2013) (“The remedy as interpreted in Allstate effectively shifts the risk of the project’s success from bondholders to the ratepayers.”). More recently, some of the most difficult issues with the Puerto Rico restructuring arose in respect of the Commonwealth’s utilities.
Though recent decisions have pared back certain revenue bond protections, significant uncertainty remains.77In a 2019 decision the First Circuit held that the holders of special revenue bonds cannot compel the debtor to apply special revenues to debt service postpetition (though the debtor could do so voluntarily). In re Fin. Oversight & Mgmt. Bd. for Puerto Rico, 919 F.3d 121, 132 (1st Cir. 2019). See Laura E. Appleby et al., First Circuit Panel Upends Protections Available to Special Revenue Bondholders, 15 Pratt’s J. Bankr. L. 1, 1(2019).
This broad-based set of legal issues illustrates the fact that, while certain aspects of the MTA’s restructuring challenges described in Part II are distinctive, they are, fundamentally, manifestations of wider concerns regarding resolution of infrastructure financial distress – and requiring broad-based solutions.
Finally, municipal bonds are typically tax-exempt for residents of the issuing state, which encourages individuals to hold municipal bonds directly,78Unlike corporate debt, most municipal bonds are held by individuals – 46% directly, and 26.8% through mutual funds (per SIFMA data) — on a geographically circumscribed basis.
but can disincentivize investment by already-tax-exempt institutional investors, such as pension funds.79A GAO Report found that “pension plans have no incentive to invest in lower-interest municipal bonds, since plan earnings are already tax exempt.” U.S. Gov’t Accountability Off., GAO-95-173, Private Pension Plans: Efforts to Encourage Infrastructure Investment 3 (1995), https://www.gao.gov/assets/hehs-95-173.pdf. This is notable because the premise of leveraging pension asserts to fund infrastructure investment is commonly suggested. See Clive Lipshitz & Ingo Walter, Bridging Public Pension Funds and Infrastructure Investing 42 (2019); Caitlin Devitt, Infrastructure Bill Features First-of-Its-Kind P3 Asset Recycling Requirement, Bond Buyer (Nov. 9, 2021, 1:57 PM), https://www.bondbuyer.com/news/infrastructure-bill-may-boost-asset-recycling (“If government-owned assets come into play [through the IIJA], U.S. public pension funds make natural investors.”).
C. Global Perspective: Public-Private ‘Hybrid’ Models
Over time, many jurisdictions around the world have become more receptive to private sector participation in infrastructure, resulting in what this Article terms ‘hybrid’ models.80See McBride et al., supra note 2.
For purposes of discussion, at a simplified level, the approaches can be segmented between three main categories:
● United States. Heavy emphasis on public sector infrastructure ownership and finance.81This is particularly with respect to transportation and water infrastructure; energy and telecommunications infrastructure have incorporated more private capital, as well as somewhat distinct business models. See id. (“United States invests less in transportation infrastructure as a percentage of GDP than many other wealthy countries, including France, Germany, Japan and the United Kingdom.”).
● Europe. Generally favoring hybrid models, including Public-Private Partnerships.82Ronald W. McQuaid & Walter Scherrer, Public Private Partnership in the European Union: Experiences in the UK, Germany and Austria, 6 Cent. Eur. Pub. Admin. Rev. 7, 7 (2008) (“The political context of governments differs between the UK, Germany and Austria, but each government currently has a positive view of Public private Partnership (PPP). There are many similarities to the drivers for PPPs in Austria, Germany and the UK.”); Yong Hee Kong, European Experiences in PPP (and some regional countries), Address at the Public Private Infrastructure Advisory Facility’s Session on Private Sector Participation (2007) (noting that in 2004/5, more than 150 PPP transactions closed in Europe “more than ½ of world total”).
● Japan and Australia. Higher prevalence of privately-owned infrastructure assets. 83William Langley, Sydney Airport Agrees .5bn Takeover Deal with Pension Funds, Fin. Times (Nov. 8, 2021), https://www.ft.com/content/00ecc8a7-7f94-444e-bd8b-5e5d516ceec9. In 1987, Japan privatized Japan Railways Group, dividing it into seven for-profit stock companies, four of which are publicly-listed. Eleanor Warnock, Lessons from Railway Privatization in Japan, Tokyo Rev. (Oct. 11, 2018), https://www.tokyoreview.net/2018/10/japan-railway-privatization; see also Stephen Smith, Why Tokyo’s Privately Owned Rail Systems Work So Well, Bloomberg (Oct. 31, 2011, 7:15 AM), https://www.bloomberg.com/news/articles/2011-10-31/why-tokyo-s-privately-owned-rail-systems-work-so-well; Max Zimmerman, What The World Can Learn From Life Under Tokyo’s Rail Tracks, Bloomberg (Sept. 10, 2020, 5:00 PM), https://www.bloomberg.com/news/features/2020-09-10/what-the-world-can-learn-from-life-under-tokyo-s-rail-tracks; John Calimente, Rail Integrated Communities in Tokyo, 5 J. Transit & Land Use 19, 19 (2012).
This sub-section presents an intellectual framework underlying the ‘hybrid’ model, and details specific approaches and considerations with respect to public-private-partnerships, and particularly concessions.84See infra Part III.
Then, it outlines asset recycling, which underlies the proposal in Part III, and discusses certain disappointing dimensions of the 2021 Infrastructure Act.
1. ‘Hybrid’ Models Overview
‘Hybrid’ models incorporating public and private sector capital and participation are not new and have long existed in varying forms across different sectors, in the U.S. and abroad.85See Jody Freeman, The Contracting State, 28 Fla. St. U. L. Rev. 155, 166 (2000).
Conceptually, the ‘hybrid’ approach is perhaps closer aligned with the imperfect public good construct.86See supra Part I.A.2.
Figure 4 below visualizes this by building on an existing World Bank framework – which provides the horizontal axis, detailing a continuum of hybrid approaches – to incorporate the vertical axis of financing options with differing levels of private sector risk assumption.87PPP Arrangements/Types of PPP Agreements, World Bank, https://ppp.worldbank.org/public-private-partnership/agreements (last visited Oct. 24, 2024).
The critical insight is the large area in the middle – corresponding to four common types of ‘hybrid’ structures (detailed below) utilized in other jurisdictions – which illustrates vast latent optionality:
Figure 3. Strategic Map: Infrastructure Ownership, Control & Financing
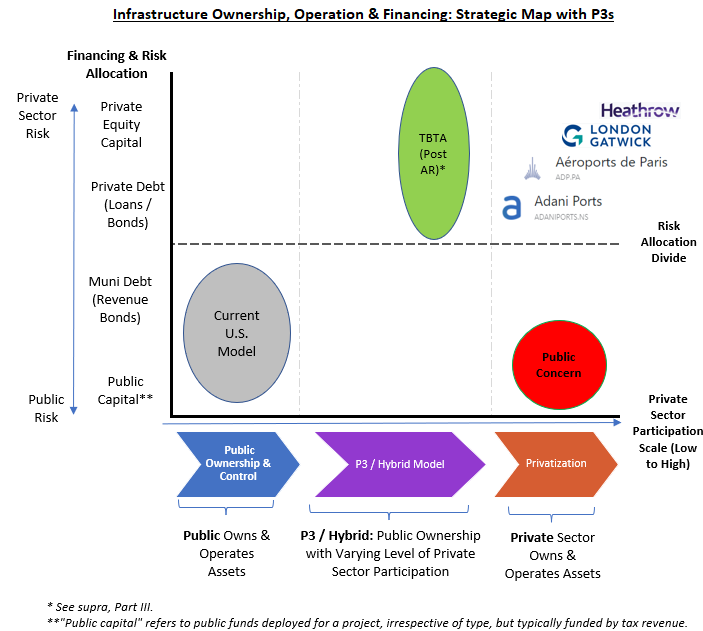
As before, the U.S. model maps to the bottom left portion, with government ownership and financing; the top right box reflects a structure closest to full privatization. The level of private sector participation increases as one moves from left to right along the x axis.
Conceptually, it is logical that for a particular asset, or asset types, the optimal ownership and capitalization structure can differ, and also evolve over time. In that respect, the division of labor and responsibility between public and private arguably has some parallels to (as well as critical distinctions from), the separation of ownership and control well-documented in the corporate context.88See infra Part IV.
2. Public-Private Partnerships: Concessions
Of the four ‘hybrid’ structures, leases and concessions generally map closest to the prevailing American conception of ‘public-private partnerships,’ or ‘P3.’89See Kelsey Hogan, Note, Protecting the Public in Public-Private Partnerships: Strategies for Ensuring Adaptability in Concession Contracts, 2014 Colum. Bus. L. Rev. 420, 422 (2014) (describing P3s).
Though terminology can vary, for our purposes, we can think of the definition of ‘public-private partnership’ as a “legally binding contract between a public sector entity and a private company . . . where the partners agree to share some portion of the risks and rewards inherent in an infrastructure project.” 90See Patrick Sabol & Robert Puentes, Private Capital, Public Good: Drivers of Successful Infrastructure Public-Private Partnerships, 4 (2014), https://www.brookings.edu/wp-content/uploads/2016/07/BMPP_PrivateCapitalPublicGood.pdf [https://perma.cc/62QS-HWTT] (providing above P3 definition, while noting “elusive” nature of “precise” definition); see also U.S. Dep’t of Transp., Report to Congress on Public-Private Partnerships viii (2004) (defining a P3 as a “contractual agreement formed between public and private sector partners, which allows more private sector participation than is traditional’); Marta Marsilio et al., The Intellectual Structure of Research into PPPs, 13 Pub. Mgmt. Rev. 763, 764 (2011) (“Although…there is still no consensus regarding its definition, considerable research into PPPs has been published…”).
Concessions, a type of P3 (and, in turn, a subset of ‘hybrid’ models) are the primary focus of discussion, as they underlie the proposal discussed in Part III with respect to the MTA.91See infra Part III.
The general concession transaction structure entails a private entity assuming the operation of a project, which is then typically funded through a usage-based model.92There is a well-established precedent upholding these types of agreements, particularly in respect of natural monopoly assets. See The Binghamton Bridge, 70 U.S. (3 Wall.) 51, 74 (1865) (holding “if you will embark, with your time, money, and skill, in an enterprise which will accommodate the public necessities, we will grant to you, for a limited time period or in perpetuity, privileges that will justify the expenditure of your money, and the employment of your time and skill.”).
Through the transaction, the public entity:
● Receives an up-front payment;93The monetization process typically involves a large-scale marketing effort, with the concession price set at auction. See supra Part I.C (discussing the Indiana Toll Road).
● Retains title and legal ownership of the asset;94The private sector entity is, formally, a newly-created special purpose vehicle, capitalized with debt and equity from investors. Investors own that vehicle, not the infrastructure asset itself.
● May retain some economics, based on the structure;95For instance, the government of NSW retained significant economics in certain assets. See infra note 118.
● No longer bears responsibility for operating and maintenance expenses (or demand risk) 96See Emily Thornton, Roads to Riches, Bloomberg, (May 7, 2007, 12:00 AM), https://www.bloomberg.com/news/articles/2007-05-06/roads-to-riches [https://perma.cc/CJY2-6WFN] (“The burden of maintaining roads, bridges, and other facilities . . . is becoming difficult to bear. Federal, state, and local governments need to spend an estimated 5.5 billion improving highways and bridges in 2007…up 50% over the past 10 years.”).
; and
● Maintains comprehensive regulatory oversight and governance.97See infra note 117-20 and accompanying text.
Concessions are distinct from ‘sales,’ as the government retains title and ownership, while allowing for significant contractual tailoring and economic oversight, well beyond what would be realistically feasible following a sale.98See infra Part III.C. (discussing distinctions).
Fundamentally, concessions and P3s are about optimizing the allocation of the portfolio of risks associated with an infrastructure project.99See Martin Blaiklock, Infrastructure Finance: An Inside View (2017).
Traditionally, in the U.S., those risks have been warehoused solely within the public sector. Reasoning from finance first principles, however, suggests that specific risks should be allocated to the particular parties best suited to bear them. For infrastructure, that re-allocation is core to P3 value creation.100“PPPs that do not transfer risk—and benefit from the private-sector’s risk-management capabilities—will likely fall short of expectations.” Frank Beckers & Uwe Stegemann, A Smarter Way to Think About Public-Private Partnerships 2 (Sept. 10, 2021), https://www.mckinsey.com/business-functions/risk-and-resilience/our-insights/a-smarter-way-to-think-about-public-private-partnerships.
Relative to the public sector, the private sector is typically better equipped to handle certain exposure, such as demand forecasting, financing structures and construction management, 101The private sector is, broadly speaking, generally best equipped in handling tasks more closely resembling typical private entity endeavors, often involving an element of risk management and resource allocation. Id. at 3-4. Beckers and Stegemann add:
In the private sector…construction and commercial risks can have massive financial consequences…For this reason, successful private contractors have built up strong capabilities in risk management across the entire life cycle of a project, from development through construction to the end of the operating phase. And private investors and lenders have developed sophisticated controlling mechanisms—the “muscles” that companies cannot survive without.
Id. See also Matt Wheeler, Collaborative Project Investigates Public-Private Partnerships, Syracuse News (Apr. 26, 2017), https://news.syr.edu/blog/2017/04/26/collaborative-project-investigates-public-private-partnerships, writing:
[A study] found that public-private partnerships infrastructure projects in the United States have a significantly greater likelihood of meeting schedule and cost requirements when compared to conventional approaches…“These partnerships are not ideal for all projects, but they are a good option for big projects”…“We found that they are particularly well-suited for transportation, hospitals, schools and water systems.”
but generally ill-suited for others, particularly with respect to harnessing positive externalities,102 . The presence of broad-based externalities suggests that the private sector will tend to under-supply infrastructure (as it is agnostic towards externalities that it cannot capture). Are Big Infrastructure Projects Castles in the Air or Bridges to Nowhere?, The Economist (Jan. 16, 2017), https://www.economist.com/buttonwoods-notebook/2017/01/16/are-big-infrastructure-projects-castles-in-the-air-or-bridges-to-nowhere [https://perma.cc/F5EY-NGPH] (“Infrastructure can have positive externalities that are not captured by investors but will benefit society (the building of the internet or America’s interstate highway system, for example).”).
addressing legal uncertainty or working through regulatory and jurisdictional frictions.103Certain such considerations identified in a Federal Highway Administration study include regulatory risks, site risks, and permitting risks. See Fed. Highway Admin., U.S. Dep’t of Transp., Risk Assessment for Public-Private Partnerships: A Primer pt. 3, at 1-3 (2012), https://www.fhwa.dot.gov/ipd/pdfs/p3/p3_risk_assessment_primer_122612.PDF. A separate FHA analysis suggests that certain political risks, such as policy changes with impact on project economics “cannot be managed by the private party at all and would be expensively priced if transferred,” which suggests optimization through retention by the public entity. See Fed. Highway Admin., U.S. Dep’t of Transp., Guidebook for Risk Assessment in Public-Private Partnerships 33 (2013), https://www.fhwa.dot.gov/ipd/pdfs/p3/p3_guidebook_risk_assessment_030314.pdf.
Because of this, the typical role for the private sector has been ‘greenfield,’ or new-build infrastructure.104For ‘greenfield’ (i.e., new-build) projects, at a high level, the process can be broken down into five phases: (i) design; (ii) building; (iii) finance; (iv) maintenance; and (v) operation. Fed. Highway Admin., U.S. Dep’t of Transp., supra note 103, at 1-1; see also Public-Private Partnership Model and its Merits in Attracting Foreign Direct Investment, Mahanakorn Partners Grp. (June 22, 2017), https://mahanakornpartners.com/public-private-partnership-model-and-its-merits-in-attracting-foreign-direct-investment.
The other core infrastructure project categories – ‘brownfield,’ referencing existing operating assets, or ‘rehabilitation,’ an intermediate category – are generally seen as preserve of the public sector, inapposite for private entities.105See E. R. Yescombe & Edward Farquharson, Public-Private Partnerships for Infrastructure—Principles of Policy and Finance 40-47 (2nd ed. 2018) (hereinafter “P3s for Infrastructure”); Practical Law Finance, Public Private Partnerships: Issues and Considerations, https://us.practicallaw.thomsonreuters.com/3-504-9995 (last visited Feb. 12, 2022); Barbara Weber et al., Infrastructure as an Asset Class: Investment Strategy, Sustainability, Project Finance and PPP 19-22 (2nd ed. 2016) (hereinafter “Infrastructure as an Asset Class”).
Some scholars explicitly consider P3s inapplicable to brownfield projects.106“Private-sector acquisition or management of existing public infrastructure without any major new capital investment or upgrading is not considered to be a PPP as defined here.” P3s for Infrastructure, supra note 105, at 9.
3. Asset Recycling
The traditional conception of P3s as only applicable to ‘greenfield’ projects historically rendered the decision framework for brownfield assets rather binary: (i) continued public sector ownership or (ii) full privatization.107‘Privatization’ is defined as the outright sale of an asset, including transfer of title, thus distinct from the proposals discussed herein.
More recently, Australia pioneered a third approach: asset recycling.108Gillian Tan, Wall Street Sees Big Wish Granted in Biden’s Infrastructure Deal, Bloomberg (June 24, 2021, 5:45 PM), https://www.bloomberg.com/news/articles/2021-06-24/wall-street-sees-big-wish-granted-in-biden-s-infrastructure-deal [https://perma.cc/N69B-WJME].
Asset recycling, or “A/R,” is a term of art for the two-phase process of (i) transitioning developed, mature infrastructure assets to private investors through a P3; and (ii) re-investing the proceeds in new infrastructure. The transaction is debt-neutral for the government, and intended to create a virtuous cycle with the asset developed in the second phase subsequently also recycled.109Geoffrey Garrett, Why the U.S. Needs to Embrace Private Sector Involvement in Infrastructure, Wharton Mag. (June 21, 2018), https://magazine.wharton.upenn.edu/digital/why-the-u-s-needs-to-embrace-private-sector-involvement-in-infrastructure/ [https://perma.cc/6EKP-FSZM] (advocating for Australia-pioneered asset recycling to close U.S. and global investment gaps); Richard Samans et al., Recycling Our Infrastructure for Future Generations 40 (2017).
The value creation could be vast. Professor Geoffrey Garrett, former dean of the Wharton School, estimates a potential asset recycling market size of $1.1 trillion, consistent with work by other researchers.110Garrett, supra note 109; see also Poole, Jr., supra note 55, at 6 (quoting an approximately trillion estimate for A/R market); Jigar Shah, It’s Time to Revitalise US Infra Through Asset Recycling, Infra Investor (May 6, 2020), https://www.infrastructureinvestor.com/its-time-to-revitalise-us-infra-through-asset-recycling.
As discussed in Part III, asset recycling can conservatively generate $33 to $53 billion in proceeds from a P3 concession for just the MTA’s bridge and tunnel assets.111As discussed and detailed, supra Part III and the figures are subject to model assumptions.
a. Two-Phase Process
As Australia’s former treasurer Joe Hockey explained, asset recycling developed as a function of necessity, finding it to be an effective way of enhancing productivity without straining government coffers. 112Joe Hockey, Asset Recycling in America (Nov. 27, 2018), https://web.archive.org/web/20190311130914/https://usa.embassy.gov.au/asset-recycling-america; see also Interview with The Hon Joe Hockey on Asset Recycling, The Public-Private Infrastructure Advisory Facility– Global Infrastructure Hub (Mar. 24, 2023), https://www.youtube.com/watch?v=1TJVI42FXX8.
A nation’s infrastructure base can be conceptualized as two components: (i) the stock of brownfield or rehabilitation projects, with associated maintenance and operating expenses; and (ii) a flow of new greenfield assets, needed to support a growing economy while adjusting to exogenous shifts like climate change, and requiring up-front capital investment.113See supra notes 104-105 and accompanying text.
The innovation of asset recycling is that it leverages the stock of assets to finance development of the flow, in the process also reducing carrying costs and ideally creating a virtuous cycle of continued reinvestment.114Is an Infrastructure Boom in the works?, Economist (Jan. 2, 2021), https://www.economist.com/finance-and-economics/2021/01/02/is-an-infrastructure-boom-in-the-works (observing large amounts of capital raised for infrastructure investment).
Fundamentally, asset recycling is thus an extension of the P3 framework but applied to ‘brownfield’ or existing infrastructure assets. Mechanically, the two-phase asset recycling process operates as follows:
- Monetization. The government monetizes revenue-generating public assets through P3, such as a long-term lease or concession.115See Part III.B detailing concession structure.
- Reinvestment. Monetization proceeds are re-invested:
- Typically, in new assets to allow subsequent ‘recycling’; or
- Rehabilitation of existing infrastructure assets.116 Practical Law Finance supra note 105.
Subsequently, the ‘new’ assets can also be recycled, creating a virtuous cycle, on a debt-neutral basis, as new investment is financed through from monetization of assets rather than borrowing.
b. Examples: Australia, Indiana and Puerto Rico
The Australian Asset Recycling Initiative (“ARI”) – as well as certain limited early U.S. transactions – illustrate the model’s application and value proposition.117Governance has been a critical feature of the program’s success, including development of a new agency focused on asset recycling. See Infrastructure, New South Wales, https://www.infrastructure.nsw.gov.au/; Financing Greenfield Infrastructure Through the Sale of Brownfield Infrastructure, Glob. Infrastructure Hub (Nov. 1, 2021), https://www.gihub.org/emerging-funding-and-finance/case-studies/financing-greenfield-infrastructure-through-the-sale-of-brownfield-infrastructure; see also Marsh & McLennan Companies, Infrastructure Asset Recycling for Governments and Investors 6-11, (2018), https://www.marsh.com/content/dam/marsh/Documents/PDF/asia/en_asia/Infrastructure_Asset_Recycling_APRC.pdf (hereinafter “MMC A/R Report”).
Australia presents a particularly apt comparable because, like the U.S., it has a dual-federalist system, with states delegated significant powers. The ARI optimized around this through state-led project selection, coupled with a 15% federal incentive for states that monetized assets and began new projects within specific timelines.
The state of New South Wales (NSW) was most active in Australia’s program, generating over $25 billion in proceeds as of 2018.118MMC A/R Report, supra note 117, at 10.
NSW structured certain transactions with retained economics, for instance selling only 50.4% lease interests in Ausgrid, the nation’s largest electricity distribution network, and Endeavour Energy, an electric generation operation.119Id.at 8-10; see also supra note 115 and accompanying text.
In all cases, the public sector largely maintained the pre-transaction regulatory structure, ensuring robust oversight.120For instance, with respect to Ausgrid: “[t]he State will continue its roles as licensor and safety and reliability regulator of Ausgrid, while the Australian Energy Regulator will continue to determine network revenue.” Past Projects, NSW Treasury, https://www.treasury.nsw.gov.au/projects-initiatives/commercial-transactions/past-projects (June 4, 2023).
At the same time, while relatively less common, a number of U.S. transactions have successful employed hybrid models, including asset recycling and P3s.
In 2006, the State of Indiana sold a 75-year concession to operate the 156-mile Indiana East-West Toll Road.121Because the winning consortium ultimately filed for Ch. 11, the transaction was sometimes considered a failure. Though deeper discussion is beyond the scope of this article, it is worth noting that the state did not retain economics, allowing it to keep the full up-front payment and protecting taxpayers, while the allocating of demand and financing risk to the private sector were not conceptually unreasonable. See generally Robert Puentes & Patrick Sabol, The Indiana Toll Road: How Did a Good Deal Go Bad? Brookings (Oct. 9, 2014), https://www.brookings.edu/articles/the-indiana-toll-road-how-did-a-good-deal-go-bad.
Reflecting commercial best practices, Indiana utilized a robust investment bank-led marketing and auction process, leading to a $3.8 billion valuation,122The winning bid was 26.2% higher than the second, priced at an estimated 60.2x EBITDA multiple, with an 80% LTV financed by .03 billion of bank loans. Xin Zhang, An Analysis of the Current Investment Trend in the U.S. Toll Road Sector (June 2008) (S.M. Thesis, Massachusetts Institute of Technology) (on file with the Institute Archives and Special Collections, Massachusetts Institute of Technology), https://dspace.mit.edu/bitstream/handle/1721.1/45620/320453281-MIT.pdf.
and negotiated extensive contractual protections, ranging from rate setting to trash removal.123 Aaron M. Renn, The Lessons of Long-Term Privatizations: Why Chicago Got it Wrong and Indiana Got it Right 9 (2016), https://media4.manhattan-institute.org/sites/default/files/R-AR-0716.pdf.
Additionally, the state was disciplined in capital allocation, reinvesting the $3.8 billion proceeds into other transportation projects, allowing for a fully-funded 10-year transportation program.124Ken Belson, Toll Road Offers New Jersey a Fiscal Test Drive, N.Y. Times (Apr. 13, 2008), https://www.nytimes.com/2008/04/13/nyregion/13indiana.html.
More recently, the Port Authority of New York and New Jersey collaborated with private parties to modernize the LaGuardia (“LGA)125Sakshi Sharma, LaGuardia Airport PPP, US, IJGlobal, https://ijglobal.com/articles/101027/laguardia-airport-ppp-us (June 30, 2016, 11:37 AM); Kalliope Gourntis, LaGuardia, the US’ Largest P3, Reaches Financial Close, Infrastructure Inv. (June 2, 2016), https://www.infrastructureinvestor.com/laguardia-the-us-largest-p3-reaches-financial-close.
and JFK airports through P3s.126In 2017, the Airport Advisory Panel recommended to then-Governor Cuomo that the Port Authority utilize a P3 to make the necessary updates to JFK airport. The contemplated transaction entailed about billion of private capital for updates to 4 of JFK’s terminals. Airport Advisory Panel, A Vision Plan for John F. Kennedy International Airport 37-38 (2017), https://www.anewjfk.com/wp-content/uploads/pdf/JFK-Vision-Plan.pdf; Redevelopment Projects, A New JFK, https://www.anewjfk.com/projects/ (last visited Nov. 1, 2024); Paul Berger, Coronavirus Delays JFK Airport’s Billion Makeover, Wall St. J. (Aug. 9, 2020, 11:00 AM), https://www.wsj.com/articles/coronavirus-delays-jfk-airports-15-billion-makeover-11596985225.
Indeed, airports are a common P3 vector with a number of transactions announced and ongoing in the U.S. and abroad.127Examples of airport P3s include the Denver Airport, Chicago Skyway, Puerto Rico Airport, and internationally, the Melbourne Airport, Sydney Airport, Heathrow Airport, London Gatwick Airport, and Amsterdam Airport Schiphol. Airport Advisory Panel, supra note 126, at 37-38.
The LGA P3 transaction involved development of a revamped Terminal B, as well as certain associated improvements, with a new entity, LaGuardia Gateway Partners, serving as the project sponsor. Through the transaction, LaGuardia Gateway Partners was responsible for designing, building, financing, operating, and maintaining the project, with a lease period through 2050. Financing for the deal closed in 2016,128Gourntis, supra note 125.
though construction completion was meaningfully delayed by Covid-19.
The preliminary verdict appears positive. LaGuardia’s newly revamped Terminal B received accolades including – in what the Wall Street Journal compared to “Arby’s winning a James Beard”129Ben Cohen, LaGuardia Airport Is No Longer the Worst. This Team Fixed It., Wall St. J. (Sep. 15, 2022, 5:30 AM), https://www.wsj.com/articles/laguardia-airport-renovation-lga-terminal-b-11663203700.
– UNESCO’s 2021 Prix Versailles award for “best new airport in the world.”130LaGuardia Airport Terminal B Wins UNESCO’s Prestigious 2021 Prix Versailles for Best New Airport in the World, The Port Authority of New York and New Jersey (Dec. 22, 2021), https://www.panynj.gov/port-authority/en/press-room/press-release-archives/2021-press-releases/laguardia-airport-terminal-b-wins-unescos-prestigious-2021-prix-versailles-for-best-new-airport-in-the-world.html.
While LGA’s P3 experience may prove above-average – Puerto Rico’s recent electric transmission P3, for instance, appears less than award winning131The Puerto Rico Electric Power Authority, or PREPA, the Commonwealth’s integrated electric monopoly, announced a plan to transition to a P3 structure. PREPA has been mired in a long-running billion restructuring, where revenue bond issues featured heavily, and is transitioning to the P3 structure in large part to deleverage. The transaction is structured as a long-term concession, with the government retaining asset ownership. Financial Oversight and Management Board for Puerto Rico, 2021 Fiscal Plan for the Puerto Rico Electric Power Authority 65 (2021).
– the transformation of “what was once regarded as the nation’s worst airport into a world-class facility” illustrates the latent potential for America’s aging infrastructure.132The Port Authority of New York and New Jersey, supra note 131.
D. The Infrastructure Investment and Jobs Act Falls Short
Though commendable for recognizing America’s infrastructure and climate-related challenges, the 2021 Infrastructure Act falls short on a number of dimensions. Most consequentially, the IIJA is estimated to provide only 18.2 to 22.4% of the ‘investment gap.’133This is because while the IIJA has a ‘headline’ number of .2 trillion, only 0 billion of the total is ‘new’ spending, with the balance reflecting funds already earmarked. At the same time, some of the 0 billion is allocated to categories that are not reflected in the ASCE ‘funding gap’ estimate. A range is provided to reflect potential distinctions in category alignments. For detailed analysis, see Breydo, supra note 8, at 1085.
In contrast, Australia’s ARI effectively leveraged private capital, coupled with extensive oversight, to enhance program scale without straining government budgets or sacrificing broader stakeholder priorities. If the IIJA was structured similarly – a 15% incentive match coupled with asset recycling – the legislation’s allocated capital could be sufficient to close the funding gap entirely.134The ARI in effect generally required only 15% of project capital to be from the Australian federal government, with the balance provided by the province. Correspondingly, based on the IIJA providing an estimated 18.2 to 22.4% of the investment gap, the observation is that this capital could theoretically be leveraged in a similar manner to provide an aggregate level of capital equal to roughly the funding gap.
The IIJA acknowledges a theoretical role for private capital, but rather unambitiously stops at the research phase, asking the Secretary of Transportation to submit a report with proposals to “address [] impediments” to private capital deployment, including asset recycling.135See Infrastructure and Investments Act, Pub. L. No. 117-58, § 611, 135 Stat. 562 (2021); Devitt, supra note 79.
As a related matter, the ARI was more fiscally efficient, creating a debt-neutral solution for the states, supported by transparent incentive funding from the federal government.
Unlike the IRA, IIJA funding is relatively murky, leaning on the Highway Trust Fund to the point of rendering it insolvent, with a Congressional Budget Office analysis of the legislation estimating a $191.5 billion shortfall by 2031.136 Cong. Budget Off., Highway Trust Fund Baseline Projections July 2021 2 (2021), https://www.cbo.gov/system/files/2021-07/51300-2021-07-highwaytrustfund.pdf (estimating 0 billion and .45 billion shortfalls in the highway and transit accounts, respectively).
That is important because, notwithstanding the generally positive multiplier associated with infrastructure investment, the net economic impact is highly sensitive to the funding profile, with the potential for negative economic returns from inapposite policy.137The Penn Wharton Budget Project found that the aggregate economic impact of the 2021 Infrastructure Act may be negative if it were entirely deficit financed, in large part due to the ‘crowding out’ effect of public capital expenditure. Jon Huntley, Explainer: Economic Effects of Infrastructure Investment, Penn Wharton Budget Model (June 15, 2021), https://budgetmodel.wharton.upenn.edu/issues/2021/6/15/economic-effects-of-infrastructure-investment.
Finally, the ARI’s structure elegantly optimized around dual-federalism, respecting traditional allocations of responsibility through state-level asset selection, but advanced national priorities through the matching program. In contrast, the IIJA arguably over-emphasizes delegation to administrative agencies, at least relative to prevailing norms; for instance, the Department of Transportation is responsible for allocating about half of new funding, totaling $274 billion. While there are logical arguments for greater utilization of federal capital for infrastructure,138See supra Part IV.
it does represent a departure from traditional divisions of responsibility, risking sub-optimal capital allocation and unnecessary jurisdictional frictions.139Kate Kelly, One of The Infrastructure Plan’s Biggest Winners is the Pavement You Drive On, N.Y. Times (Feb. 19, 2022) (citing Federal Highway Administration guidance on project prioritization that state officials felt “undercut them”), https://www.nytimes.com/2022/02/19/us/politics/infrastructure-plan-asphalt.html.
II. Case Study: The MTA’s Tribulations & Restructuring Limitations
The challenges – and opportunities – facing U.S. infrastructure are well illustrated by the New York Metropolitan Transportation Authority (“MTA” or “MTA Group”), proprietor of New York City’s subway system. The MTA is the largest revenue bond issuer and a cornerstone of the $4 trillion municipal debt market.140See Largest Issuers of Municipal Green Bonds in the United States as of July 15, 2021, Statista (Sept. 2021), https://www.statista.com/statistics/1290006/largest-issuers-of-municipal-green-bonds-usa [https://perma.cc/B7XD-YU3G] (showing that MTA Group entities are the first and fifth largest issuers of municipal green bonds in 2021, with a total of about .3 billion.).
It is also critical for both economic activity and day-to-day life in the nation’s financial center.141As of Q4 2021. See infra Appendix II for full capitalization summary and data.
The MTA is struggling under a debt load exceeding $50 billion, reeling from over $20 billion of Covid-19-related losses and facing potential long-term demand deterioration.142 Metro. Transp. Auth., MTA Annual Disclosure Statement Update 3 (2020), https://new.mta.info/document/24571.
At the same time, the MTA’s “state of crisis” pre-dates Covid-19, reinforcing the long-standing nature of the underlying issues.143Richard Ravitch, New York’s Subways Need an Independent M.T.A., N.Y. Times, (Mar. 29, 2019), https://www.nytimes.com/2019/03/29/opinion/new-yorks-subways-mta.html.
Though perhaps exceptionally acute, the MTA’s circumstances are also not unique. Its challenges closely parallel those facing infrastructure nationwide – with early 2022 transit utilization 59% below pre-pandemic levels,144During COVID-19, Road Fatalities Increased and Transit Ridership Dipped, U.S. Gov’t Accountability Off. (Jan. 25, 2022), https://www.gao.gov/blog/during-covid-19-road-fatalities-increased-and-transit-ridership-dipped.
an aggregate $39.3 billion public transit funding shortfall and over $40 billion of unfunded liabilities.145 EBP US, Inc., The Impact of the COVID-19 Pandemic on Public Transit Funding Needs in the U.S. 1(2021), https://www.apta.com/wp-content/uploads/APTA-COVID-19-Funding-Impact-2021-01-27.pdf
On a relative basis, Boston’s MBTA is arguably more leveraged than the MTA, with $5.4 billion of debt against less than one-tenth of the revenues. The Chicago Transit Authority carries $4.44 billion of debt, while Washington’s MATA has $2.7 billion.146 Mass. Transp. Auth., Basic Financial Statements, Required Supplementary Information and Other Supplementary Information 8-9 (2021); Chi. Transit Auth., Financial Statements and Supplementary Information 17 (2020); Washington Metro. Area Transit Auth., Comprehensive Annual Financial Report 17 (2021).
Thus, with some caveats, the themes identified in the case study are, in many respects, broadly applicable nationwide.
This part of the Article is divided in two sections. First, it offers an overview of the MTA’s governance, financials and capitalization, and subsequently discusses the MTA’s twin challenges of Covid-19 and climate change adaptation, as well as federal support to date. Second, it details limitations on the MTA’s ability to restructure its obligations, due to policy, contractual and legal constraints.
In sum, the MTA is an essential public entity facing deep financial challenges, but unable to restructure its obligations – illustrating the necessity of innovative solutions.
A. Overview, Financials & Covid-19
The MTA operates the nation’s largest “integrated mass transportation” network, comprised of New York City’s famed subway, bus lines and commuter trains, as well as toll bridges and tunnels in and out of the city. The system was created through the municipalization and merger of two private lines with a third government-controlled competitor.147This is why some lines are denoted with numbers and others with letters. See Lauren Cook, History of the MTA: Learn About the City’s Transit System from Its Inception, AMNY (June 17, 2016), https://www.amny.com/transit/history-of-the-mta-learn-about-the-city-s-transit-system-from-its-inception-1-11931586 (observing history of train designations, and earlier private sector operation); see also supra notes 50-53.
The MTA is a public benefit corporation and a component unit of the State of New York, established in 1965 pursuant to New York Public Authorities Law Title 11.148N.Y. Pub. Auth. Law § 1263; Metro. Transp. Auth., Dedicated Tax Fund Green Bonds, Series 2017A (Climate Bond Certified) 11 (2017).
A public benefit corporation is a “corporate entity separate and apart from the State of New York . . . without any power of taxation.”149In New York, public benefit corporations are “created by the State for the general purpose of performing functions essentially governmental in nature.” Clark-Fitzpatrick, Inc. v. Long Island R.R. Co, 70 N.Y.2d 382, 387 (1987).
The MTA Group is structured as a group of “related entities”, with the MTA itself essentially functioning as a holding company above subsidiary public benefit corporations, and adjacent to affiliate entities responsible for different aspects of the system.150The Related Entities, Metro. Transp. Auth., http://web.mta.info/mta/compliance/pdf/MTA-Creation-Structure.pdf (last visited Feb. 4, 2022).
The MTA Board “serves as the overall governing body of these related entities,”151The MTA is governed by a 23-member board, with members appointed by the State governor and subject to approval by the State senate. Leadership, Metro. Transp. Auth., https://new.mta.info/transparency/leadership (last visited Nov. 7, 2024).
which are considered component units of the MTA.152Because of this structure, the entities are consolidated into one reporting entity for accounting purposes, though the MTA also breaks out the financials for each component unit. Metro. Transp. Auth. Interim Financial Statements As of and for the Six-Month Period Ended June 30, 20215, https://new.mta.info/document/61251 (hereinafter, “MTA 2021 Financials”).
These component units maintain some interrelationships, but fundamentally operate independently.
Thus, the MTA is not unlike a large conglomerate with distinct business units ultimately overseen by a single board of directors.153See infra note 290.
As detailed in Appendix II, the MTA Group consists of ten primary entities, the most pertinent of which can be segmented into two core components:154The “Related Entities” include three support entities and a total of seven transportation operating units, of which the NYCT and TBTA are sub-component groups. See Appendix II.
- Transit and Commuter Systems (henceforth, collectively, the “Transit System”), comprised of the NYC subway (formally, the “NYC Transit Authority” or “NYCT”),155N.Y. Pub. Auth. Law § 1203-a (creating the Manhattan and Bronx Surface Transit Operating Authority as a subsidiary corporation).
bus lines (the “MTA Bus Company”) as well as the Long Island Rail Road and the Metro North Commuter Railroad (collectively, the “Commuter Trains”); and - the Triborough Bridge and Tunnel Authority (“TBTA”), “a public benefit corporation empowered to construct and operate toll bridges and tunnels and other public facilities in the City.”156TBTA consists of seven bridges and the Queens Midtown Tunnel and Hugh L. Carey Tunnel. The Port Authority of New York and New Jersey is responsible for intra-state bridges and tunnels connecting the states, including the GW Bridge, Lincoln Tunnel and Holland Tunnel. Bridges & Tunnels, Port Auth. of N.Y. and N.J., https://www.panynj.gov/bridges-tunnels/en/index.html (last visited Nov. 7, 2024).
1. Operations & Financials
At a high level, the MTA has two core top-line drivers: (i) operating revenues, comprised of transit system fares and TBTA tolls; and (ii) dedicated taxes and government subsidies at the state and local levels. Historically, operating revenues made up about 56% of the MTA’s top-line, with taxes and subsidies covering the balance. In 2019, for instance, the MTA generated operating revenues of $9.1 billion, supplemented with $7.3 billion of dedicated taxes.157See Appendix I.
The chart below shows MTA revenues by component unit for the period from 2015 to 2021.158 Metro. Transp. Auth., MTA 2022 Final Proposed Budget November Financial Plan 2022-2025 (2021), https://new.mta.info/document/65091; Metro. Transp. Auth., MTA 2021 Financial Proposed Budget: November Financial Plan 2021-2024 (2020), https://new.mta.info/document/24121.
The data can be divided into two periods: (i) the ‘baseline’ between 2015 and 2019, and (ii) Covid-19’s impact in 2020 and 2021. During the baseline period, revenues were extremely consistent and steadily increasing, reflecting the MTA’s large and growing customer base with a relatively inelastic demand profile.159 Paul J Dyson & Joseph J Pezzimenti, Metropolitan Transportation Authority, New York; Joint Criteria; Note; Transit 7 (2020).
As discussed below, this is precisely the revenue structure most attractive to fixed income investors, allowing for high system leverage. COVID-19, represented by the red oval, was a “once in a 100-year fiscal tsunami,” resulting in a 56.2% collapse in NYCT revenue.160Press Release, Pat Foye, MTA Chairman and CEO, MTA Announces Cares Act Funding Exhausted Tomorrow (July 23, 2020, 1:45 PM), https://new.mta.info/press-release/mta-announces-cares-act-funding-exhausted-tomorrow.
Figure 4. MTA Component Unit Revenues: 2015 to 2021
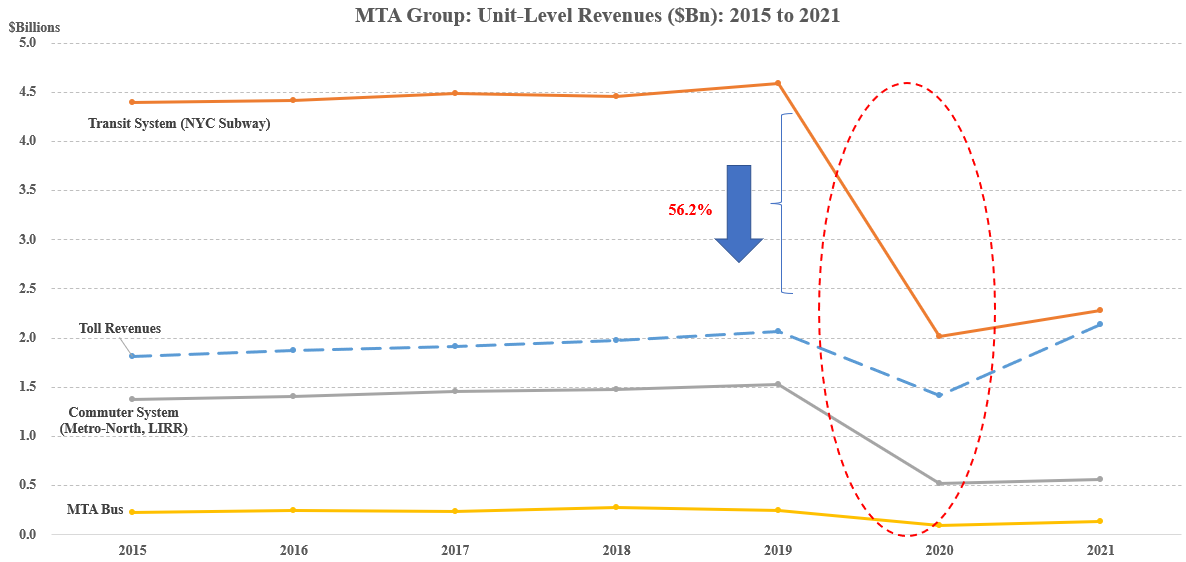
Historically, the subway (highest line above, in orange), was by far the MTA’s largest component, responsible for between 54% and 56% of baseline period revenues. TBTA tolls, the second largest top-line component, accounted for between 23% and 25% of baseline period revenues. The Commuter Trains were third largest, and the bus system a significant fourth.
Economics vary considerably across MTA operating units. Most importantly, the TBTA is the only ‘profitable’ part of the system, contributing the entirety of unit-level operating income and generating cash flow to subsidize the rest of the MTA Group. Further, the TBTA held up significantly better during Covid-19, with a much shallower decrease and faster rebound.
In the 2015-2019 baseline period, the MTA Group essentially operated on a break-even basis, with the revenues just matching expenses, even after including tax subsidies.161See Appendix II.
To put it differently, the MTA historically operated with minimal margin for error.
2. Capitalization
The MTA’s aggregate funded debt exceeds $51 billion, with $50.3 billion of direct obligations and nearly a billion of indirect liabilities as of 2021.162The Hudson Yards bonds are termed ‘indirect’ obligations because they are not MTA-issued but enjoy a seven-year-long guarantee. Michelle Kaske & Martin Z Braun, Hudson Yards Makes Muni-Bond Market History for New York Agency, Bloomberg (Sept. 14, 2016, 2:16 PM), https://www.bloomberg.com/news/articles/2016-09-14/hudson-yards-set-to-make-bond-market-history-for-new-york-agency.
The system’s operations are inherently expansive and capital-intensive and generate insufficient earnings to fund investment needs. Because of this, the MTA has required extensive borrowing to finance capital costs across its operating segments. Historically, its robust top-line has supported a relatively low cost of capital and generally favorable market access.
Figure 5 below provides a snapshot of the MTA’s largest obligations as of Q1 2021.163See Appendix III (detailing the full capital structure).
As common for U.S. infrastructure, the MTA’s obligations are largely “revenue bonds,” supported by dedicated revenue streams and paid through a ‘trust’ structure.164See Part I.C.3.
Figure 5. MTA Group Debt Summary (Q4 2021)
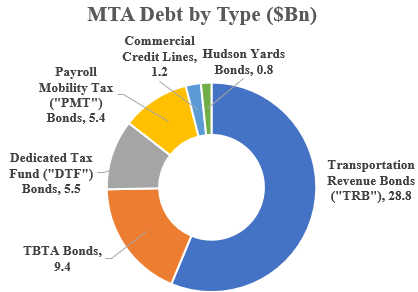
The MTA’s pledged revenue obligation (as of Q4 2021) fall into four primary categories, with two backed by fare or toll operating revenue, and the others representing securitizations of tax revenues165See Appendix III.
:
- $28.75 billion of Transportation Revenue Bonds (“TRB”), equal to 58.6% of total pledged obligations, backed by Transit System “farebox revenue” from the NYC subway, buses and commuter trains;
- $9.41 billion of TBTA bonds, backed by bridge and tunnel toll revenues;166Includes 7M subordinated and 3M second subordinated tranche. See Appendix II.
- $5.53 billion of dedicated tax fund (“DTF”) bonds, backed by the Mass Transportation Trust Fund (“MTTF”) and Metropolitan Mass Transportation Operating Assistance (“MMTOA”) receipts; and
- $5.37 billion of payroll mobility tax revenue-backed obligations (“PMT Bonds”).167The PMT, signed into law in 2009 by then-Governor Paterson, is a tax imposed on the payroll expense of employers and the net earnings of self-employed individuals engaging in business within the MCTD at a pre-set schedule. The PMT bonds are also supported by MTA Aid Trust Account receipts, which includes collections from certain government fees. Cindy Wu et al., TBTA/ MTA Payroll Mobility Tax 3 (2021).
The MTA’s financial position deteriorated significantly in 2021, with debt increasing $5.2 billion and liquidity shrinking by $1, despite extensive federal support.168See Appendix III (detailing year-over-year change from Q1 2020 to Q1 2021).
Further, limited investor appetite for additional fare-linked exposure required the MTA to introduce the PMT bonds, a new obligation type backed by securitized tax-revenue, perceived as “more stable.”169Michelle Kaske, N.Y. MTA Gives New Bondholders Haven From Subway Ridership Drop, Bloomberg (Apr. 19, 2021, 12:26 PM), https://www.bloomberg.com/news/articles/2021-04-19/n-y-mta-gives-new-bondholders-haven-from-subway-ridership-drop (describing the PMT bond issuance and structure, analogizing it to steps taken by Puerto Rico.); Michelle Kaske, New York MTA Kicks Off First-Ever Payroll-Tax Bond Deal, Bloomberg (Apr. 20, 2021, 5:19 PM), https://www.bloomberg.com/news/articles/2021-04-20/new-york-mta-kicks-off-first-ever-payroll-tax-bond-deal (noting that due to perception of the Kanske PMT bonds as “more stable” they “carry AA+ credit ratings . . . six steps higher than S&P’s BBB+ grade and five levels above Fitch’s A- rating” on the TRBs).
That said, despite initial shocks170Martin Z Braun, Fear Drives MTA, Illinois Yields to Emerging-Market Heights, Bloomberg, (May 5, 2020, 3:33 PM), https://www.bloomberg.com/news/articles/2020-05-05/fear-drives-mta-illinois-bond-yields-to-emerging-market-heights (Noting MTA yields implied market perception of it being “a riskier investment than the government of Mexico”).
, the bond market view appears to have calmed considerably, with MTA spreads relatively tight relative to higher credit quality issuers.171Based on review of Bloomberg data.
The below is an MTA-produced diagram, detailing the consolidated flow of funds underlying its obligations:172MTA Flow of Funds, as of March 17, 2021. For relative simplicity, this figure excludes revenues pledged for the MTA’s 2020-2024 capital program.
Figure 6. MTA Pledged Revenues Flow of Funds
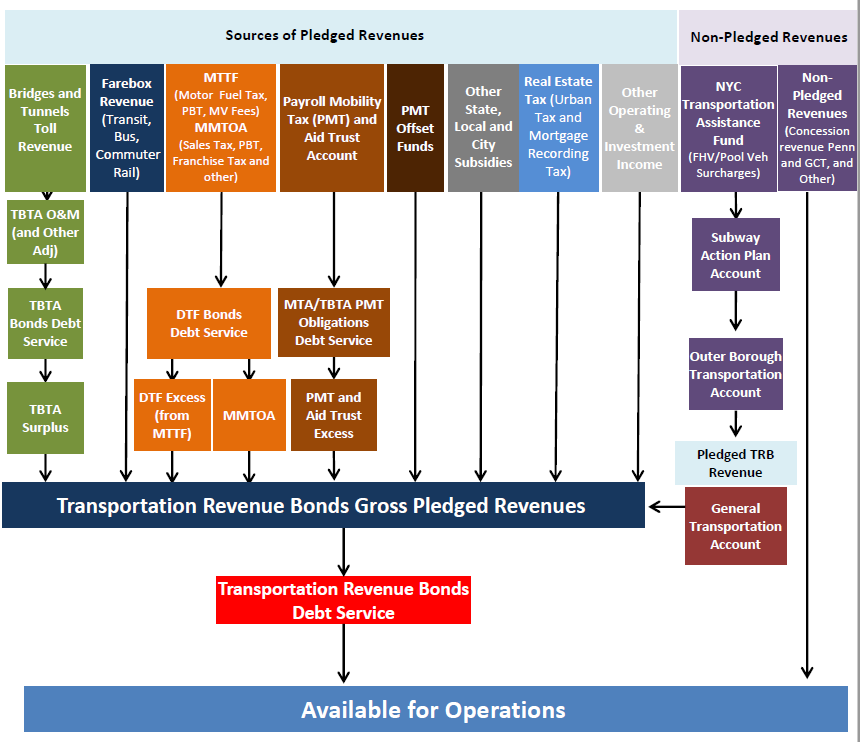
The MTA pledged revenue structure reflects a system built around subsidizing the NYC subway — a deliberate policy determination intended to optimize the associated externalities.173“The use of TBTA surpluses to subsidize transit and commuter operations has been an integral part of the MTA structure and represents a public policy decision by the NYS Legislature on funding mass transit.” Cindy Wu et al., Triborough Bridge and Tunnel Authority (TBTA) 7 (2020).
The flow of funds works essentially as follows. The TBTA and NYCT, both operating entities, collect toll and farebox revenues, which are first used for their operating expenses and then go to pay for debt service. The DTF and PMT are not operating entities – really, closer to securitizations of tax revenue – and thus don’t have operating expenses, only their debt service. Because of the Transit System’s structural shortfall, the three other types of bonds – TBTA, DTF and PMT – provide “excess funds” (after operating expenses and their debt service) to support the TRB obligations, without which the MTA Group could not meet the TRBs’ debt service requirements.
The critical point to understanding the MTA Group’s financial predicament is that the TRBs constitute the majority of the its obligations, but the Transit System does not generate sufficient revenue to cover their associated debt service requirements, effectively requiring cross-subsidization.
3. The MTA’s Challenges
The consistency of the MTA’s historical performance allowed markets to get comfortable with a capital structure leveraged to perfection and contractual terms set in stone – including a ‘no bankruptcy’ clause. Then, the world changed.
As described in a recent State Comptroller report, the MTA is “facing significant long-term financial challenges, including risks to its capital plan and pressure from escalating debt, while the impacts of climate change demand a sharper focus on preparation for and response to extreme weather events.”174 Off. of the State Deputy Comptroller for the City of N.Y., A Review of Capital Needs and Resilience at the MTA 1 (2021), https://www.osc.state.ny.us/files/reports/osdc/pdf/report-14-2022.pdf (emphasis added).
Many of the MTA’s challenges pre-date the Covid-19 pandemic but have been significantly exacerbated by it.175Emma G. Fitzsimmons, Cuomo Declares a State of Emergency for New York City Subways, N.Y. Times (June 29, 2017), https://www.nytimes.com/2017/06/29/nyregion/cuomo-declares-a-state-of-emergency-for-the-subway.html.
At the same time, the core issues – particularly systematic infrastructure underinvestment, exacerbated by climate change – are hardly unique to the MTA, but rather a reflection of issues consistently facing the U.S. infrastructure sector as a whole.176See supra note 3; see also Paul Burton, Climate Extremes Vex Northeast Transit Systems, Bond Buyer (Aug. 6, 2021, 11:28 AM), https://www.bondbuyer.com/news/climate-extremes-threaten-transit-systems-in-new-york-boston.
This section proceeds in three parts. First, it will discuss the ‘revenue side’ in respect of the impact of Covid-19 on the MTA’s financial position. Second, it will discuss the ‘cost side’ focusing on effects of climate change through a discussion of the MTA’s now-delayed $51.5 billion capital program.177Id.
As discussed below, though impossible to precisely quantify,178Robert Lee Hotz, Climate Scientists Encounter Limits of Computer Models, Bedeviling Policy, Wall St. J. (Feb. 6, 2022, 10:10 am), https://www.wsj.com/articles/climate-change-global-warming-computer-model-11642191155.
climate change adaptation and mitigation efforts will unambiguously require significantly higher capital expenditure for decades to come.179See Krishnan, supra note 42, at viii (noting McKinsey estimates that a net-zero transition will require annual global investment of .2 trillion; though the report does not detail U.S. infrastructure-specific figures, it offers one contextual reference point of the magnitude).
Finally, it will outline pandemic period government support measures, and challenges to further assistance.
a. Revenues: Covid-19 Ridership Declines
Covid-19’s unprecedented shock nearly created a liquidity crisis for the MTA. Though, the potentially more significant impact may ultimately be structural degradation of the MTA’s long-term revenue profile, and, correspondingly, credit quality stemming from secular demand changes.
An MTA-commissioned McKinsey study estimated Covid-19’s aggregate impact to total about $20 billion through 2024, with “[o]perating revenues…projected to be down $10.7 billion, subsidies $6.9 billion lower, and expenses $2.7 billion higher.” 180 Metro. Transp. Auth., supra note at 143, 15-16.
This is likely to be particularly acute for the NYCT subway system, which supports nearly $30 billion of TRBs. The MTA’s 2022 Final Proposed Budget was unambiguous, stating that:181 Metro. Transp. Auth., MTA 2022 Budget and 2022-2025 Financial Plan Adoption Materials II-63 (2021), https://new.mta.info/document/68251.
NYCT’s financial outlook remains fragile, with current projections…forecasting NYCT will only reach 87.5% of pre-pandemic ridership by the start of 2024, resulting in significantly less farebox revenue.
The chart below shows MTA ridership figures across system components on a quarterly basis as compared to pre-Covid-19 levels:
Figure 7. MTA Group: Ridership Volume Pre-and Post-Pandemic (2020, 2021)

The data can be divided into three core periods, each represented by a different oval:
- The first (red oval, at left), reflects the direct impact of Covid at the worst part of the pandemic in early 2020. That period saw the sharpest utilization declines across system units. The MTA’s subway system (dotted red line) – its largest revenue driver – experienced some of the deepest declines, with ridership down over 90% in April, 2020; the Metro-North and LIRR saw even steeper deterioration.182Patrick McGeehan, Commuter Trains Have Kept Rolling. Will All Those Riders Ever Return?, N.Y. Times (Aug. 28, 2021), https://www.nytimes.com/2021/08/28/nyregion/commuter-railroad-conavirus-new-york.html (“Before the coronavirus pandemic, New York City’s commuter railroads had one main job: They delivered 300,000 tightly packed passengers to work each morning, and carried them home again in the evening”).
However, consistent with the revenue data above, the TBTA experienced a far shallower drop and faster recovery. - The second period (light green oval, at center), corresponds to the nationwide vaccine roll-outs starting around mid Q1 through Q2 2021. This period saw significant recovery across system components, with the TBTA returning to utilization above 90%. The NYCT improved to nearly 40% utilization, with the LIRR and Metro-North close behind.
- The final period (teal oval, at right) corresponds to Q4 2021. Due to continued vaccination increases, the NYCT has improved utilization to nearly 60% of pre-Covid levels, with the LIRR and Metro-North reflecting a similar upward trend. TBTA utilization, meanwhile, essentially recovered to pre-Covid levels, with some days in November 2021 actually exceeding pre-Covid period traffic.
The trends in the ridership and revenue data are highly consequential for thinking about the future of the MTA Group, and, correspondingly, the system’s options for regaining its financial footing. Infrastructure utilization is, in many ways, a reflection of day-to-day life.183Id.
Shifting work and life patterns – including the increase in remote and ‘hybrid’ work184Lev Breydo, Legal Sector’s Tech-Enabled COVID-19 Adaptation: Distinct Challenges, Unparalleled Long-Term Opportunities for Dynamic Digital Transformation, SciTech Lawyer (Jan. 2021), https://www.americanbar.org/groups/science_technology/publications/scitech_lawyer/2021/winter/legal-sectors-techenabled-covid19-adaptation-distinct-challenges-unparalleled-longterm-opportunities-dynamic-digital-transformation (discussing the prevalence of remote hearings and overall legal industry adaptation towards digitalization).
– ultimately raises serious questions about the long-term demand structure for the Transit System185McGeehan, supra note 183.
and TBTA in a post-pandemic world.186For instance, while the first order demand shock from Covid-19 impacted both commuters and discretionary travelers equally, commuting may experience greater long-term secular demand shifts, reducing NYCT utilization. The TBTA, however, may experience increasing TBTA demand, as individuals coming to the office only a few days a week may feel most comfortable driving. Dmitry Chechulin et al., Building a Transport System That Works: Five Insights from Our 25-City Report 4 (2021) (observing that as a result of the pandemic “People who relied on private cars, as well as those who used public transport, actually increased their use of private cars, even as the overall number of trips dipped,” while use of public transit declined for both groups).
b. Costs: Climate Change
The revenue side of the equation is unfortunately only half the problem for the MTA. “With extreme weather events becoming more and more frequent – [climate change] clearly has to be a major priority for the agency,” remarked Janno Lieber, the MTA’s chief executive officer at a September, 2021 board meeting.187Michelle Kaske, N.Y. MTA CEO Says Climate Change a ‘Major Priority’ for System, Bloomberg (Sept. 15, 2021, 4:37 PM), https://www.bloomberg.com/news/articles/2021-09-15/n-y-mta-ceo-says-climate-change-a-major-priority-for-system.
Indeed, for over a decade, the MTA has viewed climate change adaptation as being “imperative.”188 Klaus Jacob et al., MTA Adaptations to Climate Change 4, (2008), https://new.mta.info/document/10451.
For our purposes, the two sets of issues are closely related as the shock from Covid-19 also forced the MTA to delay its long-planned capital investment program to conserve cash, as noted above.
The economics and engineering literature has identified the “increasingly urgent” issues, as well as the novel challenges, facing transit systems as a result of climate change and adaptation.189Qing Miao et al., Through the storm: Transit Agency Management in Response to Climate Change, 63Transp. Rsch. Part D: Transp. and Env’t 421, 421(2018) (“While many transit agencies have experience and expertise coping with weather disruptions, they are confronted with the new challenge of identifying and developing appropriate long-term adaptation strategies to address greater risk and uncertainty associated with climate change.”); see also Henrik Thorén & Lennart Olsson, Is Resilience a Normative Concept?, 6 Resilience, 112, 113 (2017).
In a recent paper, Martello, et al, developed a quantitative framework for incorporating climate costs, using the Massachusetts Bay Transit Authority in Boston as a case study.190Michael V. Martello et al., Evaluation of Climate Change Resilience for Boston’s Rail Rapid Transit Network, 97 Transp. Rsch. Part D: Transp. and Env’t 1, 2 (2021).
In many ways, the impacts of climate change are not necessarily creating wholly new issues, as much as they are exacerbating long-standing problems in novel ways and at unprecedented rates.191The issue is not confined to the MTA or New York with Philadelphia and other cities across the Northeast experiencing similar problems. Burton, supra note 177 (noting that in Boston, rising seas pose an “existential threat’” to the MBTA rail network).
In 2012, system-wide damage from Hurricane Sandy totaled over $5 billion; the MTA has not yet completed repairs.192Garth Johnston, Breaking Down the MTA’s Billion Hurricane Sandy Price Tag, Gothamist (Nov. 28, 2012), https://gothamist.com/news/breaking-down-the-mtas-5-billion-hurricane-sandy-price-tag (outlining list of Sandy-related expenses provided by the MTA).
In 2017, then-governor Cuomo declared a “state of emergency” following a series of tragic events.193Fitzsimmons, supra note 176 (noting delays and an accident in Harlem where riders “feared they would die after the train struck a tunnel wall and began to fill with smoke”).
More recently, in September, 2021 Hurricane Ida’s record-setting rainfall caused subway flooding in 46 locations, requiring the MTA cut service overnight, leaving many passengers stranded.194Ciara Nugent, Hurricane Ida Raises the Question: How Can Cities Keep Subways Safe in an Era of Climate Crisis Flooding? Time (Sept. 3, 2021, 3:22 PM), https://time.com/6095111/subways-climate-change-floods.
A New York Times analysis determined that the MTA’s maintenance budget was largely unchanged over the last 25 years, despite passenger volume more than doubling.195Brian M. Rosenthal et al., How Politics and Bad Decisions Starved New York’s Subways, N.Y. Times (Nov. 18, 2017), https://www.nytimes.com/2017/11/18/nyregion/new-york-subway-system-failure-delays.html.
To address these issues, in 2018, the MTA unveiled an ambitious capital program, which called for $51.5 billion of system-wide investment in the 2020-2024 period (the “2020-24 Capital Program”), 70% more than the 2015-2019 capital program.196 Metro. Transp. Auth., MTA Capital Program 2020-2024, 2 (2019), https://new.mta.info/document/10641.
The 2015 capital program “did not directly address climate resilience,” while the 2020-24 Capital Program discussed climate largely in context of broader capital needs.197 Off. of the State Deputy Comptroller for the City of N.Y., supra note 175, at 1.
Due to the financial impact of Covid-19, the MTA delayed deploying the 2020-24 Capital Program. While the MTA has filed its 2021 budget, which incorporates various elements of capital spending, it has yet to directly address how the 2020-2024 Capital Program will be amended and deployed.
While the MTA has been understandably reluctant to put an explicit number on the costs of climate change, the impact is clearly large, requiring significant new investments, well above and beyond prior programs – and potentially beyond the $51.5 billion capital plan delayed by Covid-19.
c. Pandemic Period Government Support
At the depths of Covid-19 in 2020 and 2021, the MTA only averted a full-blown liquidity crisis through multiple rounds of federal support, totaling “almost $15 billion.”198Paul Berger, Sarah Feinberg Tapped to Lead New York’s Metropolitan Transportation Authority, Wall St. J. (June 8, 2021, 9:34 AM), https://www.wsj.com/articles/sarah-feinberg-tapped-to-lead-new-yorks-metropolitan-transportation-authority-11623157589 (emphasis added).
First, in 2020, the MTA received an approximately $4 billion infusion from the March, 2020 CARES Act, the single largest allocation of $25 billion in transit support.199See supra note 161.
Over the course of 2020, demand did not recover, resulting in large deficit forecasts going into 2021. The MTA warned of potentially drastic service and workforce reductions – affecting up to 40% of subway lines and 9,300 jobs.200Michelle Kaske, New York MTA Warns Of 40% Subway Cut, Shedding 9,300 Jobs, Bloomberg, (Nov. 18, 2020, 1:20 PM), https://www.bloomberg.com/news/articles/2020-11-18/new-york-mta-eyes-9-367-layoffs-as-agency-waits-for-federal-aid.
Because of this, the MTA received a second $4 billion federal infusion through the December 2020 stimulus bill,201Id.
which addressed the MTA’s 2021 shortfall, postponing potential layoffs and service cuts.202Bloomberg Surveillance, MTA Layoffs, Service Cuts Will Be Avoided in 2021: CEO Foye, Bloomberg (Dec. 23, 2020, 8:28 AM), https://www.bloomberg.com/news/videos/2020-12-23/mta-layoffs-service-cuts-will-be-avoided-in-2021-ceo-foye-video.
The MTA also expects to receive “more than $10 billion” of direct and indirect support through the 2021 Infrastructure Act.203Press Release, Janno Lieber, MTA Chair and CEO, Statement from Acting MTA Chair and CEO Janno Lieber on Passage of Infrastructure Bill (Nov. 5, 2021, 11:30 PM), https://new.mta.info/press-release/statement-acting-mta-chair-and-ceo-janno-lieber-passage-of-infrastructure-bill.
Along with fiscal support, when it was shut out of bond markets,204Paul Burton, Reeling New York MTA Taps into .9B Fed Facility, Bond Buyer (Dec. 10, 2020, 7:05 PM), https://www.bondbuyer.com/news/reeling-new-york-mta-taps-into-2-9b-fed-facility.
the MTA also leveraged federal monetary measures, borrowing $3.36 billion from the Federal Reserve’s Municipal Liquidity Facility.205The MTA used the Facility twice, including a .9 billion draw in December 2020, shortly before the program expired. See Municipal Liquidity Facility, Fed. Rsrv. Bank of N.Y, https://www.newyorkfed.org/markets/municipal-liquidity-facility (last visited Nov. 14, 2024).
The only other issuer to utilize the facility was the state of Illinois which borrowed $3.2 billion.206Id.
New York state’s fiscal year 2020-21 budget also incorporated provisions to support the MTA, including increasing its total bond cap to $90.1 billion (from $55.497 billion) and creating “new authorization” for the MTA to issue up to $10 billion of bonds annually for three years through 2022.207 Metro. Transp. Auth., MTA Annual Disclosure Statement Supplement 5 (2020), http://web.mta.info/mta/investor/pdf/2020/040320COVIDUpdateSupp.pdf.
The MTA has taken advantage of this though the PMT bond issuances, however the market’s appetite for additional exposure appears unclear.
Additional proposals to support the MTA have included a levy on package deliveries, notwithstanding the lack of a clear nexus to the MTA’s activities and operations.208Proponents argue that a package delivery surcharge could raise up to billion annually; others, including the Tax Foundation, have argued that the proposal would have adverse impacts with less revenue than proponents estimate. John Samuelsen & Robert Carroll, The Tax That Can Save the MTA: A Federal Bailout Is Necessary but Insufficient, N.Y. Daily News (Dec. 7, 2020, 10:00 AM), https://www.nydailynews.com/opinion/ny-oped-how-to-save-the-mta-20201207-pinjgghz75hkxlwfxmbyq7lc3e-story.html.
Further federal support is hardly unproblematic, either. Particularly as the worst of the pandemic passes, allocations of federal capital for state-specific projects raises distinct policy questions in respect of the traditional divisions of responsibility for infrastructure.209See supra Part I.B.
Lawmakers from California and Texas, for instance, may query federal resource allocation to effectively subsidize the New York MTA, from which they do not benefit.
The combination of government support and delayed capital spending have stabilized the MTA’s near-term financial position. However, it continues to project multi-billion-dollar deficits and has not ruled out future service cuts or workforce reductions.210Michelle Kaske, N.Y. Subway Sees 3 Million Riders in Busiest Day Since Omicron, Bloomberg, (Feb. 9, 2022, 6:17 PM), https://www.bloomberg.com/news/articles/2022-02-09/n-y-subway-sees-3-million-riders-in-busiest-day-since-omicron (noting that MTA is “in talks with state lawmakers to find new ways to . . . address future shortfalls”).
Based on the data, it appears that exogenous changes have fundamentally altered the core revenue model predicating the MTA’s $50 billion of debt, logically requiring changes to reflect the MTA’s its altered reality.
B. Why Can’t the MTA ‘Right-Size’ its Obligations?
Normally, an entity facing severe revenue pressure and an increasingly unsustainable debt burden would have broadly three sets of avenues for healing itself: (i) improving the ‘business’; (ii) re-negotiating its obligations out-of-court; or (iii) if all else fails, bankruptcy protection.
This section discusses each of these three approaches, concluding that the MTA cannot utilize any, leaving it stuck between a rock and the proverbial hard place.211See infra Part III (discussing asset recycling as a solution).
1. Limited ‘Commercial’ Options
The MTA’s financials show a business facing secular demand declines across key customer segments, coupled with a rising cost structure. For a private company, the traditional avenues for endogenously ‘right sizing’ its financial position fall into two categories: (i) increasing revenues or (ii) decreasing costs. However, this is where the MTA’s position as an imperfect public good with public purpose –responsibilities beyond the numbers – comes into sharp focus.212See supra Part I.B.
Specifically, for the MTA, potential fare increases or service cuts present policy concerns, as such measures can arguably function like a regressive tax, most punitive on individuals with limited means.
The MTA’s operating revenues are basically a function of price (fares) and quantity (number of users). As a result of Covid-19, quantity declined while prices stayed constant, resulting in less revenue. However, despite likely long-term demand pressure, the MTA cannot simply raise rates to make up the difference.213Michelle Kaske, New York MTA Warns It Will Slash Service, Raise Fares Without Federal Aid, Bloomberg, (Aug. 26, 2020, 2:38 PM), https://www.bloomberg.com/news/articles/2020-08-26/new-york-mta-mulls-deep-cuts-to-subway-commuter-train-service.
Demand elasticity for public transit appears highly non-linear across income and wealth. This, in many ways, is this is a function of the uneven distribution of return-to-work mandates. While many higher-income ‘white collar’ workers can work remotely, the typically-lower-income ‘critical workers’ have often had to continue coming to work even during the pandemic.214Hugh Son, Morgan Stanley CEO Says He Was Wrong on Return-to-Office Push: ‘Everybody’s Still Finding Their Way’, CNBC (Dec. 13, 2021, 4:56 PM), https://www.cnbc.com/2021/12/13/morgan-stanley-ceo-says-he-was-wrong-on-return-to-office-push.html.
Middle class workers are now starting to return as well.215Joan C. Williams, How the Return to Office Work Is Impoverishing the Middle Class, Politico (Dec. 8, 2021, 11:31 AM), https://www.politico.com/news/agenda/2021/12/08/returning-to-office-middle-class-523937.
These lower-income individuals are most price sensitive and least likely to have access to more expensive substitutes, like ride-share services.216At the same time, discouraging public transit use exacerbates climate change as substitutes are often higher emission. Josyana Joshua, Public Transit Use Must Double to Meet Climate Targets, City Leaders Warn, Bloomberg (Nov. 10, 2021, 9:39 AM), https://www.bloomberg.com/news/articles/2021-11-10/transit-use-must-double-to-meet-1-5-c-goal-mayors-warn.
Given the circumstances, fare increases simply do not seem like the right thing to do, and, to its credit, the MTA is holding back for the time being (in part due to federal aid).217Michael Gold, Subway Fare Increase ‘Off the Table’ Thanks to Infrastructure Bill, N.Y. Times (Nov. 15, 2021), https://www.nytimes.com/2021/11/15/nyregion/mta-train-subway-nyc.html.
The MTA’s cost structure is also relatively fixed, as cost-reduction measures would entail decreasing service or further paring back capital investment.218See supra note 202.
However, given the nature of the NYC subway system – with a dense Manhattan core and ever-thinner arteries towards the boroughs – service cuts also carry elements of a regressive tax, with disproportionate impact of reduced transit options for lower-income individuals living outside of Manhattan. At the same time, given the continued effects of climate change discussed in Part II.A.3, additional reductions in capital investment are problematic and likely to increase long-run total expenses.219Some have suggested operating improvements as an avenue for cost savings. As a general matter, operational matters are outside the scope of this article, but from first principles though a viable supplement on the margin, such changes are likely an order of magnitude short of the needs. See Alex Armlovich, The Track to Fiscal Stability: Operations Reforms for the MTA, Citizens Budget Comm’n (May 25, 2021), https://cbcny.org/sites/default/files/media/files/REPORT_MTA-Ops_05252021.pdf.
Furthermore, a combination of higher fares and deteriorating service (not to mention safety issues)220Michelle L. Price, NYC Mayor Says Even He Doesn’t Feel Safe on Subway System, Phila. Trib. (Jan. 19, 2022), https://www.phillytrib.com/news/state_and_region/nyc-mayor-says-even-he-doesnt-feel-safe-on-subway-system/article_91fd08e3-040f-507b-80f9-716f7e57508e.html.
could further reduce the ridership base, leaving ever-fewer people to shoulder the MTA’s debt burden, and risking a utility “death spiral.”221A utility ‘death spiral’ refers to a vicious cycle where a network with high fixed cost amortization has to raise rates due to rate base erosion, causing further rate base erosion, in a vicious cycle. Monica Castaneda et al., Myths and Facts of the Utility Death Spiral, 110 Energy Pol’y 115 (2017); Pranshu Verma, Public Transit Officials Fear Virus Could Send Systems Into ‘Death Spiral’, N.Y. Times (Aug. 15, 2020), https://www.nytimes.com/2020/07/19/us/coronavirus-public-transit.html.
Fundamentally, the reality is that the MTA was on shaky financial footing pre-pandemic; Covid-19 accelerated the challenges, but did not cause them, suggesting that even a return to pre-pandemic volumes will not be a comprehensive solution. However, particularly given the MTA’s rapid financial deterioration and economic importance, it cannot afford to continue kicking the proverbial can.222See supra note 144 (former MTA chair describing organization being in “a state of crisis”).
2. Contractual Hurdles to Creditor Negotiations
Given the clear policy constraints on exercising traditional commercial levers, the MTA’s next step may be to attempt to re-negotiate its obligations to creditors. For many organizations, an out-of-court transaction provides a viable alternative for ‘right-sizing’ obligations.
While a bankruptcy prohibition, detailed in the next sub-section, is rather uncommon – indeed, largely impermissible for corporate or individual debtors223The case law has long held waivers of the right to file for bankruptcy protection to be unenforceable as a matter of public policy. In re Weitzen, 3 F. Supp. 698, 698 (S.D.N.Y. 1933) (holding contractual agreement to waive the benefit of bankruptcy is unenforceable); Fallick v. Kehr, 369 F.2d 899, 904 (2d Cir. 1966) (noting in dictum that advance agreements to waive the benefits of bankruptcy are void); In re Gulf Beach Dev. Corp., 48 B.R. 40, 43 (Bankr. M.D. Fla. 1985) (holding “the Debtor cannot be precluded from exercising its right to file Bankruptcy and any contractual provision to the contrary is unenforceable as a matter of law”); see also Marshall E. Tracht, Contractual Bankruptcy Waivers: Reconciling Theory Practice and Law, 82 Cornell L. Rev. 301, 302 (1997).
– for sovereign borrowers it is very much the effective norm, as there is no formal forum or process for adjustment of debts of a sovereign nation.224Lev Breydo, The IMF’s Way Forward for Sovereign Restructuring, Reg. Rev. (Dec. 17, 2014), https://www.theregreview.org/2014/12/17/breydo-imf-restructuring.
Thus, all sovereign debt restructurings are, in highly simplified terms, carried out on a contractual basis through bilateral negotiations with creditors. In effect, a sovereign debt restructuring is a modification of contracts for entities without the ability to file for bankruptcy. From that vantage point, while the MTA’s challenge is somewhat unique, it is not entirely novel.
In practice, however, an out-of-court solution for the MTA is unlikely to be viable for at least 3 reasons.
First, to account for the lack of an insolvency forum, the contractual structure of sovereign bonds has evolved to include features that the MTA’s bonds lack. A key innovation in this regard was the development of so-called collective action clauses, or CACs.225W. Mark C. Weidemaier & Mitu Gulati, A People’s History of Collective Action Clauses, 54 Va. J. Int’l L. 51, 54 (2014).
CACs are essentially a mechanism to bind creditors to a transaction upon reaching a requisite threshold of votes. CACs can be (i) ‘single series,’ applying to solely a particular series of bonds, or (ii) ‘global,’ allowing modifications to be made by bondholders aggregated across series.226Lee C. Buchheit & Mitu Gulati, Drafting a Model Collective Action Clause for Eurozone Sovereign Bonds, 6 Cap. Mkts. L. J. 317, 320-22 (2011).
Many of the MTA’s bonds, however, do not appear to have contractual modification provisions at all – in other words, they did not contemplate ever being amended.227Based on a review of MTA bond documents.
That is markedly worse than even the circumstances facing distressed sovereigns, like Lebanon and Argentina.228Based on a review of Argentine and Lebanese bond documents. See Lev E. Breydo, Health of Nations: Preventing a Post-Pandemic Emerging Markets Debt Crisis, 23 Nev. L.J. 463, 495-96 (2023).
Global collective action clauses allowed Argentina to effectuate a modification by votes of bondholders aggregated across series in its recent restructuring. Even Lebanon’s sovereign contracts, which lack global CACs, allow for modification of individual series with 75% consent.229See Lev Breydo, New Coverage: Lebanon’s .8B Debt Negotiations Complicated by Series-Specific Collective Action Clauses, Reorg Rsch. (Feb. 25, 2020).
Figure 8. Collective Action Clauses – Argentina, Lebanon & The MTA
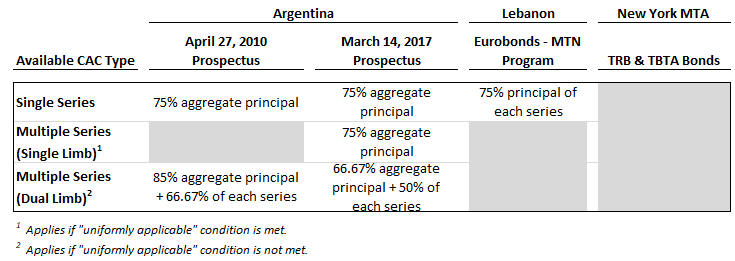
Lacking these contractual provisions makes restructuring the MTA bonds out of court very difficult as it would require wholesale consent, which appears problematic given innately high hold-out risk.230“Hold-outs” refers to creditors who decline to support a restructuring acceptable to other creditors with the goal of leveraging their position for higher payment. Chuck Fang, et al., Restructuring Sovereign Bonds: Holdouts, Haircuts and the Effectiveness of CACs (Eur. Centr. Bank, Working Paper No. 2366, 2020), https://www.ecb.europa.eu/pub/pdf/scpwps/ecb.wp2366~5317a382b3.en.pdf.
A second and closely related issue is the sheer complexity of the MTA’s capital structure, which features hundreds of outstanding bonds, with a range of tranche sizes and maturities.231The MTA’s MSRB page, for instance, includes 868 distinct series of bonds. See Metropolitan Transportation Authority (NY), Elec. Mun. Mkt. Access, https://emma.msrb.org/IssuerHomePage/Issuer?id=F5876F607AB52D5CE043151E0A0A64B4 (last visited Nov. 14, 2024).
Those bonds are held by a wide array of investors – including likely many individuals232See supra Part I.C.
— the identities of which are often not publicly known. Even with CACs in place, the structure would make for an unwieldy transaction; without CACs it may well prove impossible.
Finally, conflict between bondholders at different issuing entities is possible, if not likely. Leverage is highest (and credit quality lowest) for the TRBs. However, those bonds benefit from a second-lien on the other three sets of cash flows, making it difficult to see how a deal could play out on a purely consensual basis.
3. Bankruptcy Ineligibility
As discussed above in Part I, dual-federalism is an integral facet of the U.S. governmental framework. This creates unique tensions for municipal bankruptcy. Bankruptcy law is a national framework promulgated by the federal government. It does not apply to the states themselves, however, because they are ‘dual-sovereigns’ alongside the federal government.233See David A. Skeel Jr., States of Bankruptcy, 79 U. Chi. L. Rev. 677, 701-11 (2012); David A. Skeel Jr., Is Bankruptcy the Answer for Troubled Cities and States?, Hous. L Rev. 1063, 1064 (2013).
Each state must specifically authorize municipal entities within it to utilize Chapter 9, the Bankruptcy Code provisions specific to “municipalities.”234Skeel Jr., supra note 234, at 1064-65.
As discussed below, covenants in the MTA’s bond documents, as well as New York state law, prohibit the agency from filing for bankruptcy. Though certain provisions of New York state law render the situation somewhat less cut-and-dry than perceived by market participants, the practical reality is that the MTA would have significant challenges in pursuing a formal debt adjudication process.
a. Lack of Chapter 9 Authorization
Chapter 9 eligibility is governed by a five-prong test under Section 109(c) of the Bankruptcy Code. The first two prongs are likely to be most relevant for purposes of this discussion.235The other requirements are that the entity “(3) is insolvent; (4) desires to effect a plan to adjust such debts; and (5)(A) has obtained the agreement of creditors . . . (B) has negotiated in good faith with creditors and has failed to obtain the agreement of creditors . . . (C) is unable to negotiate with creditors . . . “ 11 U.S.C. § 109(c). 11 USC § 101(32)(C) defines ‘insolvent.’ See generally Clayton P. Gillette, How Cities Fail: Service Delivery Insolvency and Municipal Bankruptcy, 2019 Mich. St. L. Rev. 1211, 1211-12 (2020).
Pursuant to those provisions, an entity is permitted to file under Ch. 9 “if and only if such entity: (1) is a municipality;236In re Las Vegas Monorail Co., 429 B.R. 770, 788-89 (Bankr. D. Nev. 2010) (providing a framework for determining whether an entity is an “instrumentality” for Chapter 9 eligibility purposes).
[and] (2) is specifically authorized . . . to be a debtor under such chapter.”23711 U.S.C. § 109(c).
The Bankruptcy Code defines a “municipality” as a “political subdivision or public agency or instrumentality of a State.”238See 11 U.S.C. § 101(40).
In New York City Off-Track Betting Corp, for instance, the court determined a public benefit corporation operating a horse betting parlor to be “‘municipality’ as defined by the current Bankruptcy Code.”239See In re N.Y.C. Off-Track Betting Corp., 427 B.R. 256, 266 (Bankr. S.D.N.Y. 2010) (finding that because “NYC OTB is a creation of the state, made for the purpose of operating a ‘revenue producing enterprise,’” “[it] is a ‘municipality’ as defined by the current Bankruptcy Code.”).
The MTA is thus quite likely to meet this definition.
The second prong is where the challenge arises. That provision holds that unlike corporate and individual debtors, a municipality cannot file for bankruptcy unless it is specifically authorized to do so. Some states explicitly prohibit municipal filings; others, including New York, condition the ability to file for Chapter 9, and may prohibit it for certain entities, as appears to be the case with respect to the MTA.240 James E. Spiotto, Primer on Municipal Debt Adjustment 8-9(2012).
Indeed, the market consensus view is that the MTA doesn’t just lack authorization to file for Chapter 9, but is specifically prohibited from doing so.241Brian Chappatta, MTA Can’t Go Bankrupt. So How Does It Survive?, Bloomberg (June 29, 2020, 6:00 AM), https://www.bloomberg.com/opinion/articles/2020-06-29/mta-can-t-go-bankrupt-so-how-does-it-survive-debt-and-bailouts.
The relevant language in the MTA’s TRB bond documents provide as follows:242 . See MTA Green Bonds (Series 2020E) Offering Document. Certain of the TBTA bonds do not include the affirmative “No Bankruptcy” covenant, but include “Agreements of the State” provisions, which state in relevant part:
The MTA Act provides that, so long as MTA has outstanding any bonds, notes or other obligations, none of . . . [the] Related Entities has the authority to file a voluntary petition under Chapter 9 of the Federal Bankruptcy Code, and neither any public officer nor any organization, entity or other person shall authorize [the] Related Entities to be or become a debtor under Chapter 9 during any such period . . .
Chapter 9 does not provide authority for creditors to file involuntary bankruptcy proceedings against MTA, MTA Bridges and Tunnels or the other Related Entities.
No Bankruptcy. State law specifically prohibits MTA, its Transit System affiliates, its Commuter System subsidiaries or MTA Bus from filing a bankruptcy petition under Chapter 9…As long as any [TRB] are outstanding, the State has covenanted not to change the law to permit MTA or its affiliates or subsidiaries to file such a petition. Chapter 9 does not provide authority for creditors to file involuntary bankruptcy proceedings against MTA or other Related Entities.
The underlying state law language referenced in the MTA TRB documents is arguably even firmer, providing that:243NY Pub. Auth. Law §§ 1207(M)(11), 1266(c), 1269.
So long as the [NYC Transit Authority] or any of its subsidiaries, or [the MTA], shall have outstanding any notes, bonds, lease, sublease or other contractual obligations…neither the authority nor any of its subsidiaries shall have the authority to file [under Ch. 9], and neither any public officer nor any organization, entity or other person shall authorize the authority or any of its subsidiaries to be or become a debtor under said chapter nine…
On their face, the provisions appear generally consistent with the market view.244 Cindy Wu et al., MTA Transportation Revenue Bonds, Series 2021A Rating Report 7-8 (2021). The report states that:
KBRA understands that New York State law further restricts the power of the MTA to file a Chapter 9 petition under Section 1269 of the New York Public Authorities Law, which does not allow a Chapter 9 filing by the MTA so long as bonds or other obligations issued by the MTA pursuant to Section 1269 or 1266-c of the New York Public Authorities Law are outstanding. Furthermore, pursuant to section 1271 of the New York Public Authorities Law, the State of New York has pledged to not alter the rights and remedies of bondholders in a way that would impair such holders, including altering the prohibition against the MTA filing a Chapter 9 petition included in Section 1269.
Indeed, analysts have noted that the MTA’s “inability to file for bankruptcy protection [is] an important criteri[on]” in supporting its ability to borrow.245Chappatta, supra note 242(quoting Fitch’s lead MTA analyst: “We’re very clear that their legal structure and their inability to file for bankruptcy protection is an important criteria . . . Absent that protection, it would have an adverse ramification for how we view the MTA’s financial leverage, which is quite substantial.”).
b. State Law Alternatives Inoperable
Aside from the sovereign context, the premise of an entity being ‘shut out’ from bankruptcy protection is uncommon, but not entirely new.246Though beyond the scope of this Article, statutes prohibiting an entity from seeking bankruptcy protection raise distinct policy considerations particularly acute for natural monopolies. Samir D. Parikh and Zhaochen He, Failing Cities and the Red Queen Phenomenon, 58 B.C. L. Rev. 599, 604 (2017) (finding that states with access to out-of-court restructuring options have lower borrowing costs).
The most prominent recent example is perhaps the Commonwealth of Puerto Rico, which found itself underdoing a severe financial crisis and unable to file for bankruptcy within existing frameworks. 247Puerto Rico v. Franklin California Tax-Free Tr., 136 S. Ct. 1938, 1949 (2016) (holding that the Bankruptcy Code “precludes Puerto Rico from authorizing its municipalities to seek relief under Chapter 9. But it does not remove Puerto Rico from the scope of Chapter 9’s pre-emption provision. Federal law, therefore, pre-empts the Recovery Act,” which Puerto Rico passed to restructure certain municipal obligations).
Puerto Rico’s predicament was ultimately addressed by the PROMESA legislation, which was inspired by A Two-Step Plan for Puerto Rico, in which Professors Skeel and Gillette proposed addressing Puerto Rico’s unique challenges by: (i) first creating a financial oversight board and, (ii) second, giving the Commonwealth a formal mechanism for adjusting its debts.248Examples cited in the paper included financial control boards in New York and Washington D.C. Clayton P. Gillette & David A. Skeel, Jr., A Two-Step Plan for Puerto Rico 1-2 (U. Pa. Inst. L. & Econ. Working Paper, Paper No. 16-3 2016); David Skeel, Notes from the Puerto Rico Oversight (Not Control) Board 34th Pileggi Lecture, 43 Del. J. Corp. L. 529, 533-34 (2019).
Here, New York State law appears to provide the MTA access to an “oversight board,” somewhat akin to the “first step.” Critically, however, the MTA likely lacks access to the second step of a “formal mechanism for adjusting its debts.”
Following New York City’s financial distress in the 1970s, New York enacted a so-called “municipal distress statute,” allowing a financial control board”249According to the statute: “the term “emergency financial control board” shall mean any such board established by state law for the municipality.” N.Y. Local Fin. Law §85.
to be put in place during a financial “emergency period,” for any “municipality,” other than the city of New York That legislation also provides a state-level mechanism250An assignment for the benefit of creditors, an alternative state-level bankruptcy tool, is unlikely to be viable for the MTA as the ABC typically operates to liquidate assets, which is inapposite here.
for the resolution of debts, subject to state court approval, rather than Chapter 9, as well as specific authorization for a financial control board to effectuate a petition in federal bankruptcy court.251N.Y. Local Fin. Law §§ 85.80, 85.90, stating:
A municipality or its emergency financial control board in addition to, or in lieu of, filing a petition under this title . . . may file any petition with any United States district court or court of bankruptcy under any provision of the laws of the United States, now or hereafter in effect, for the composition or adjustment of municipal indebtedness.
However, the main hurdle to utilizing the state-level provisions is 903 of the Code, which generally prohibits state-specific proceedings from binding non-consenting creditors.252Section 903 of the Bankruptcy Code provides in part: “[A] state law prescribing a method of composition of indebtedness of [its] municipality may not bind any creditor that does not consent to such composition.” 11 U.S.C. § 903(1). The legislative history explains: State adjustment acts have been held to be valid, but a bankruptcy law under which the bondholders of a municipality are required to surrender or cancel their obligations should be uniform throughout the States, as the bonds of almost every municipality are widely held. Only under a Federal law should a creditor be found to accept such an adjustment without his consent. See H.R. Rep. No. 2246, 79th Cong., 2d. Sess. 4 (1946); Frederick Tung, After Orange County: Reforming California Municipal Bankruptcy Law, 53 Hastings L.J. 885, 889 n.16 (2002) (“[S]ection 903 of the Bankruptcy Code was enacted specifically to preempt state bankruptcy laws…The provision was passed in order to overturn the Supreme Court’s decision in Faitoute, 316 U.S. 502, which upheld a New Jersey statute authorizing state adjustment plans for insolvent municipalities to bind creditors without their consent.”).
In Puerto Rico v. Franklin California Tax-Free Tr., the Supreme Court reiterated that Section 903 acts as a “pre-emption provision” for purposes of state-law-created bankruptcy processes.253Puerto Rico v. Franklin California Tax-Free Tr., 136 S. Ct. 1938, 1949 (2016).
This suggests that New York likely could not utilize its municipal distress statute to bind creditors without their consent.
Further, putting aside Section 903, satisfying the contractual bond document language discussed above would require making the difficult argument that an emergency financial control board is not a “public officer nor any organization, entity or other person” for purposes of the MTA Act.
Perhaps even more importantly, Chapter 9 access would not necessarily be a panacea for the MTA or other revenue bond issuers, given the challenges in restructuring revenue bonds.254See supra notes 71-77 (discussing special revenue bond protections).
Thus, while many dimensions discussed above are inherently distinctive to the MTA, the underlying issues – deteriorating financials and insufficient avenues for adjustment of obligations – are broad-based, with applicability to a range of municipal infrastructure entities.
III. Asset Recycling: MTA Application
“What actually needs to happen is for the US to adopt an infrastructure asset recycling programme, and now it has a golden opportunity to do so.”255Shah, supra note 110.
– Jigar Shah, Director, Department of Energy Loan Programs Office
A tailored asset recycling strategy provides a highly attractive avenue for resolving the MTA’s financial challenges, with significant implications for infrastructure policy nationwide.
This Article finds that a concession for just the TBTA assets can, conservatively, generate $33 to $53 billion in proceeds, sufficient to repay the majority, if not entirety, of the MTA’s $51 billion debt load. As a result, the MTA will have the financial wherewithal to make long-needed investments for the future – without further government support.
This section is organized in three sub-parts. First, it discusses the asset recycling proposal, with a focus on structural safeguards. Second, it details the underlying valuation analyses, including a waterfall model showing the deleveraging impact. Finally, it contrasts the proposal with alternatives, illustrating superior value creation and distinguishing it from privatization.
A. Transaction Structure
Asset recycling, as discussed above, is a two-phase process consisting of: (i) monetization of existing infrastructure and (ii) reinvestment of the proceeds.256See supra Part I.C.3.
Applied to the MTA it could be structured as follows (henceforth, the “MTA A/R”):
- First, through a long-term concession, the transaction would ‘monetize’ only the TBTA assets – not the Transit System itself (the “TBTA Concession” or “TBTA P3”).
- Second, proceeds would be used to deleverage the Transit System, rather than for investment in new infrastructure, as is more typical.257New project investments are more typical because that allows for subsequent ‘recycling’ of the reinvested capital, with the goal of creating ‘virtuous cycle.’ New assets reinvestment may be appropriate for other infrastructure systems. Here, the societal value is resolving the MTA’s financial distress and positioning it for the future.
From a technical perspective, as shown in Figure 12 below, the MTA A/R transaction is predicated on separation of the two operating segments, and a concession agreement for only the TBTA assets.258See Part III.C. (discussing separation mechanics).
The transaction would not contemplate any operational or ownership changes to the Transit System.
Figure 9. MTA A/R Transaction Structure
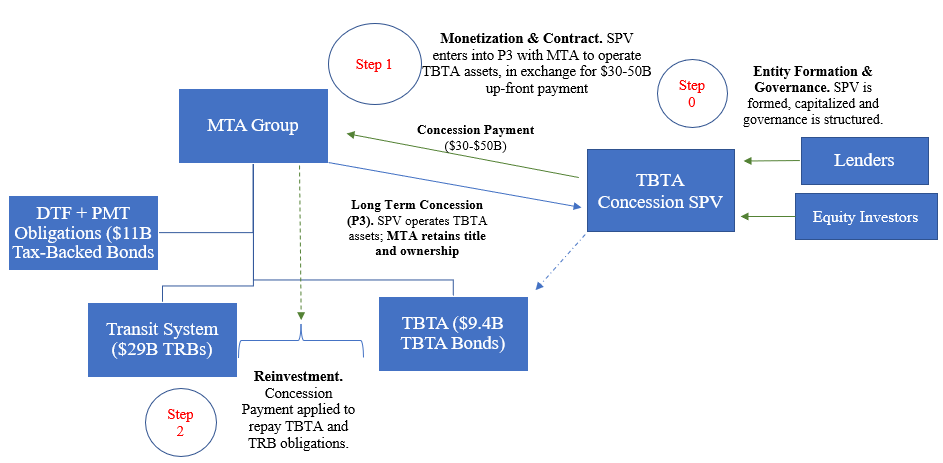
Three aspects of the above structure are notable for our purposes:
- Entity Formation & Governance (Step 0). Preliminary step of forming and capitalizing the concessionaire special-purpose-vehicle (SPV), the entity formally party to the TBTA Concession, and establishing bespoke governance reflecting the specific agreement and associated safeguards. 259The legal structure of the entity could take various forms, including for instance, from a tax perspective, a REIT, yieldco or perhaps MLP. See supra note 94 (describing structure of SPV concessionaire entity). The public entity, as well as any relevant state and federal regulatory bodies, should have the opportunity to comprehensively review investor composition to ensure consistency with policy objectives and otherwise.
This critical gating step is denoted as preliminary step 0 (rather than step 1) to reflect that the primary transaction should not move forward unless this can be satisfactorily accomplished.260As noted, the governance considerations with respect to infrastructure, as codified in this preliminary step, represent a target-rich area for further research.
- Monetization / Contract (Step 1). Under the agreement, the MTA:
- Receives $30-50 billion concession payment
- Retains ownership and title of the TBTA assets; and
- Transfers all maintenance obligations to the SPV
- Reinvestment (Step 2). The MTA applies the Concession Payment proceeds to repay its obligations.261See Part III.B.3.
As a general proposition, the asset recycling framework offers the MTA significant optionality in respect of process control, transaction structuring, retained economics, governance and oversight.262See supra notes 90-97.
For instance, the MTA could retain residual economics in the TBTA assets, mimicking Australia’s approach in some transactions.263See supra note 95; see also MMC AR Report, supra note 117, at 8 (detailing Australia ARI transaction structures, including retained economics and interests).
The TBTA Concession must be particularly thoughtful with respect to the regulatory structure.264See infra Part IV.
Of particular importance are toll rates and asset maintenance, where there must be continuity comprehensive public sector oversight and regulation, akin to Australia’s approach.265See supra Part I.C. (discussing Australian approach).
Another guidepost may be rate-setting for investor-owned utilities, with substantive rate changes requiring regulatory approval following a public process with comprehensive disclosures.266Though somewhat beyond the scope of this discussion, investor-owned utilities are generally regulated by a state commission that approves all changes to methodology, mandates a schedule of maintenance and capital spending and prescribes a regulatory rate of return. See supra note 97.
B. Concession Valuation
Perhaps the single most intriguing aspect of the proposed transaction is the extremely attractive valuation of a long-term TBTA asset concession. This sub-section of the Article empirically analyzes both the monetization and reinvestment phases of the proposed transaction.
The concession is valued using two methodologies,267Compared to the corporate counterpart, the infrastructure valuation literature is relatively underdeveloped, presenting an area for further research, particularly in respect of different transaction structures and contractual features. See David Espinoza & Jeremy W.F. Morris, Decoupled NPV: A Simple, Improved Method to Value Infrastructure Investments, 31 Constr. Mgmt. & Econ. 471, 471–96 (2013); J. Doyne Farmer & John Geanakoplos, Hyperbolic Discounting Is Rational: Valuing the Far Future with Uncertain Discount Rates (Cowels Found., Working Paper, Paper No. 1719, 2009) (discussing hyperbolic discounting and curve shape-based valuation of long-dated cash flows); Arturo Cifuentes & David Espinoza, Infrastructure Investing and the Peril of Discounted Cash Flow, Fin. Times (Nov. 3, 2016), https://www.ft.com/content/c9257c6c-a0db-11e6-891e-abe238dee8e2 [https://perma.cc/K83A-YJEK].
each of which embeds multiple layers of highly conservative assumptions: (i) EBITDA multiples, the industry-standard approach, which produces a midpoint value of $43.05 billion; and (ii) discounted cash flows, which yields a range between $37.03 and $42.74 billion.
1. EBITDA Multiples
EBITDA multiples are a common valuation methodology for mature infrastructure assets, such as toll roads and bridges.268Toll roads and bridges are often grouped together because of shared toll-based revenue structure and natural monopoly features.
Methodologically, the main advantages are relatively simplicity, with limited inputs, and a capital structure neutral framework, making it preferable to the DCF in this context. Prior research on toll asset transactions has found an EBITDA range between 18.3x and 35.5x, with an average of 26.2x, and suggested a range between 20x and 30x (the approach taken below).269 Poole, Jr., supra note 55, at 33.
The author’s review of publicly-available data regarding recent transactions found an average of 29.6x EBITDA, with the two U.S. transactions in the data set both above 30x.270Data set composed of: A25 toll road in Montreal (26x), AirporklinkM7 in Australia (28x), Queensland Motorways in Australia (27.5x) and M6 Toll Road in Britain (30x), as well as Chicago Skyway (35x) and Indiana Toll Road (31x), both post-restructuring with notably lower EBITDA multiples than the initial transactions. See supra Part I.C.
Other research has observed a significant premium placed on U.S. infrastructure by investors, finding an EBITDA multiple of 60x, relative to the mid-teens for comparable French assets.271Germà Bel & John Foote, Comparison of Recent Toll Road Concession Transactions in the United States and France 25 (Xara de Referencía en Economia Aplicada, Working Paper No. XREAP2007-11, 2007).
The below sensitivity analysis uses as the midpoint the TBTA’s MTA-estimated 2022 forward EBITDA of $1.72 billion, with a range between $1.67 and $1.82 billion.272Computed based on the MTA’s forecasts included in their 2022 Final Proposed Budget. Estimated O&M and personnel expenses are subtracted from revenues. This potentially understates EBITDA, as certain sub-line items included by the MTA within O&M likely would constitute A&D, and so should be added back in. However, the conservative approach is used to provide further downside cushion.
Given the pricing on U.S. transactions, a multiples range between 25x and 35x is likely more appropriate, but to provide a conservative estimate, the shaded box corresponds to a 20x to 30x range. At 20-30x, the analysis indicates a midpoint of $43.05 billion, with a range between $33.4 and $53.2 billion; at 25x to 35x, the midpoint is $51.66 billion, with a range between $41.8 and 62.02 billion.
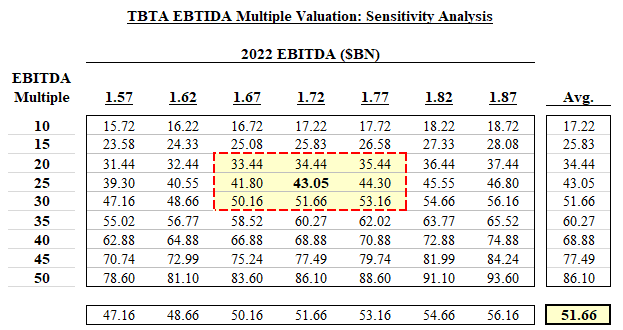 Figure 10. TBTA Concession – EBITDA Multiples Valuation & Sensitivity Analysis
2. Discounted Cash Flows
The analysis below values the TBTA Concession based on discounted cash flows, with forecasted figures for 2022-2025 from the MTA Group’s 2022 Final Proposed Budget.273See Metro. Transp. Auth., supra note 182, at II-4.
Importantly, P3 valuations are highly sensitive to the concession length and overall contractual structure. Correspondingly, the below shows the present value based on contract lengths of 30, 50, 75, and 99 years (common in such deals).274See supra Part I.C. (discussing Australian transactions).
As shown below, the MTA forecasts that TBTA revenue will be relatively steady between $2.2 and $2.3 billion going forward, while costs will widen somewhat from $501 million in 2021 to $600 million by 2025. The model incorporates the impact of higher post-deal leverage, resulting in increased interest expense totaling about $867.6 million annually, and net income around $850 million annually through 2025.275Net income on a constant capital structure basis is about billion annually.
Cash flows are discounted based at the estimated pro forma post-transaction weighted average cost of capital.276Importantly, the analyses in this Article were computed in late 2021 and are thus based on the then-prevailing market conditions and financing rates. In the period between the Article’s completion and publication, interest rates have significantly increased, and the yield curve has materially steepened. The Article does not empirically incorporate an interest rate sensitivity analysis. In part because of this, Part III.B.1 provides EBITDA-multiple-based computations which are not sensitive to interest rates and also reflect the more common, industry prevailing approach.
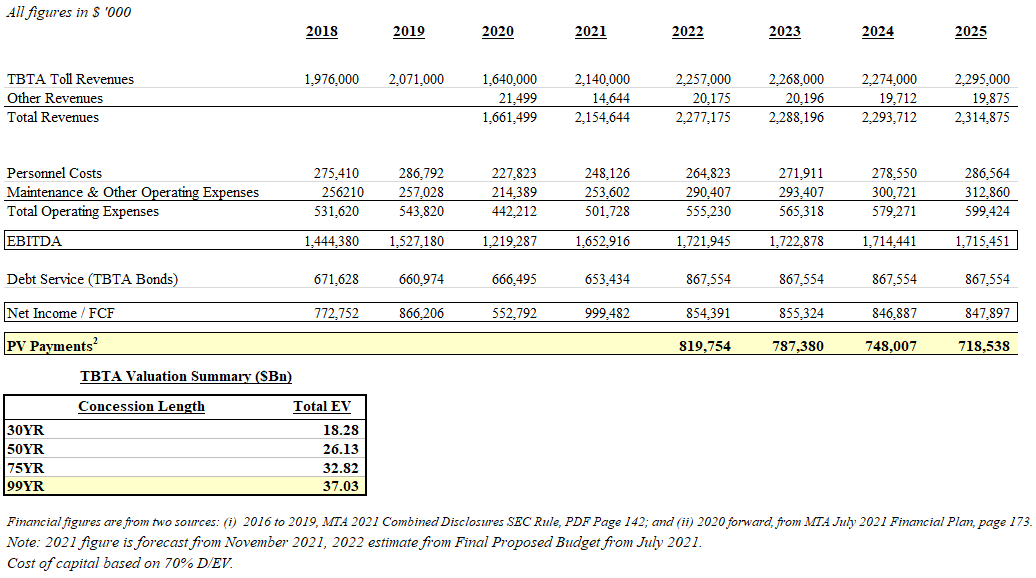 Figure 11. TBTA Concession – DCF Valuation
For a 99-year lease, the analysis finds a value of $37.03 billion, incorporating pro forma impact of increased post-transaction leverage and interest expense, or $42.74 billion on a constant capital structure basis. This is likely rather highly conservative given that the analysis (i) uses a highly conservative estimate of the cost of capital;277Inputs are as follows: (i) cost of capital based on S&P global infrastructure index developed market constituents (highly conservative given business distinctions and embedded EM risk); (ii) tax rate based on Prof. Damodaran’s NYU Stern cost of capital dataset; with (iii) 70% D/EV, reflecting high asset maturity and market standards. See generally Dieter Helm, Infrastructure Investment, the Cost of Capital, and Regulation: An Assessment, 25 Oxford Rev. Econ. Pol’y 307, 311 (2009); Frederic Blanc-Brude & Majid Hasan, The Valuation of Privately-Held Infrastructure Equity Investments, 68-75 (2015); U.S. Dep’t. of Transp., Financial Structuring and Assessment for Public–Private Partnerships: A Primer 8 (2013), https://www.fhwa.dot.gov/ipd/pdfs/p3/p3_primer_financial_assessment_1213.pdf.
and (ii) models a steady margin contraction, which implicitly assumes relatively low volume without meaningful rate increases.
3. Concession Reinvestment Waterfall Analysis
This analysis focuses the second phase of asset recycling – capital reinvestment – illustrating the transformative balance sheet impact.
Figure 12 shows a simplified capitalization, accounting for the P3 transaction pro forma based on EBITDA multiples between 20x and 40x. The analysis applies a waterfall of payments, with funds first going to the TBTA bonds, then the TRBs, then DTF and then PMT, and finally the outstanding revolver.278As a technical matter, repayment is subject to contractual covenants in the MTA’s outstanding bonds. For some of the PMT bonds, the TBTA is formally the issuing conduit, suggesting that obligations may have to be paid before the TRB bonds. This analysis applies a simpler waterfall to illustrate the main points. At the same time, the change would have no substantive impact for purposes of this Article.
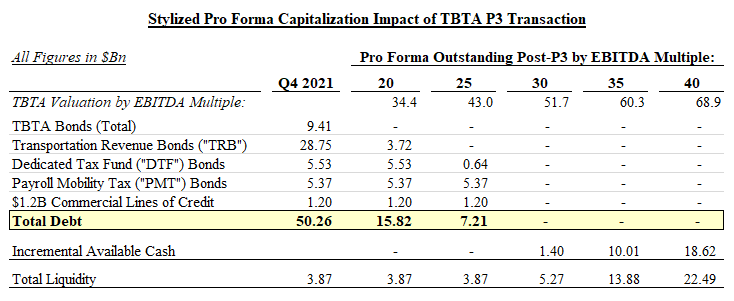 Figure 12. Asset Recycling: Capital Reinvestment Pro Forma Waterfall Analysis
The above analysis shows a vast impact on the MTA Group’s financial profile at any of the EBITDA multiples — specifically:279Many of the MTA Group’s bonds trade above par and some (though not necessarily all) of the TBTA bonds do not appear to contemplate early repayment, even at a premium. Though somewhat beyond the scope of this discussion, the transaction could be structured such that TRB bondholders are given the option to: (i) tender at par (or a small premium); (ii) retain their bonds but surrender TBTA liens in exchange for replacement liens on a cash-collateralized DSRF tranche; or (iii) accept roll-over debt in the TBTA Concession SPV (or deleveraged TRB issuer).
- Even at a 20x EBITDA multiple, all of the TBTA bonds, and $25 billion, or 87%, of TRB bonds would be paid off.
- At a 25x multiple, the entirety of the TBTA and TRB bonds, as well as most of the DTF bonds would be paid down, leaving total debt of just $7.21 billion.
- At 30x, 35x and 40x, the transaction would repay the entirety of the MTA Group’s debt, while yielding incremental payments of $1.4 billion, $10.01 billion and $18.62 billion, respectively.
The resulting deleveraging would create an entity with not only a sustainable debt profile, but also capacity to invest incremental billions into building the sustainable infrastructure of the future.
C. Benefits & Contrast to Alternatives
The proposed MTA A/R transaction creates significant new value, representing a financially superior option relative to available alternatives. At the same time, from a policy perspective it is distinct from – and distinctly preferable to – a privatizations or sale of assets.
1. Financially Superior to Additional Debt
The value creation from asset recycling is aptly illustrated through a comparison to a potential alternative: the TBTA taking on more debt, and using the proceeds to retire TRB obligations.280As a technical matter, TBTA and TRB bond documents provisions likely prohibit this. It is presented as an ‘alternative’ to illustrate asset recycling value creation.
There is some industrial logic to this, as the TBTA could support more debt but instead subsidizes the TRBs – this would just move the obligations to the ‘box’ truly responsible.
Figure 13 below shows the stylized pro forma impact. Theoretically, the TBTA could support approximately between $10 and $15 billion of additional debt.281TBTA 2022 debt service of 6.6M, .4B of obligations, and .005B net income imply, on a (highly simplified) constant interest expense basis, additional capacity of about .2B. to billion range presented to account for both of increased debt cost from leverage, or lower-cost refinanced debt (given prevailing rate environment).
As illustrated in the “new bond issuance” box below, this would imply reducing TRB obligations from $28.75 billion to between $13.75 and 18.75 billion, and increasing the TBTA’s leverage by a corresponding amount.
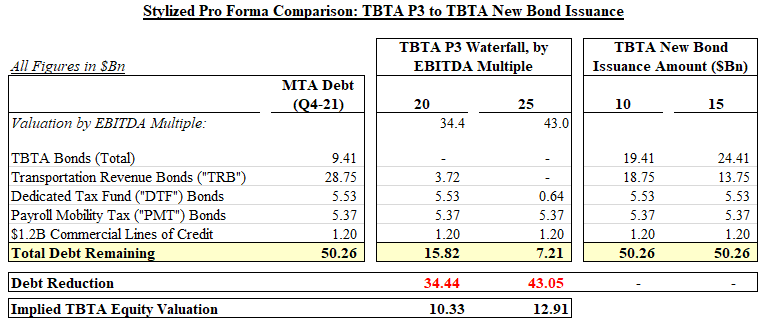 Figure 13. Pro Forma Comparison: MTA A/R vs Incremental TBTA Bond Issuance
While resulting in a somewhat more sustainable TRB debt burden, the critical failing of this approach is that it does not reduce aggregate MTA debt, but merely re-arranges it. Though a more logical allocation, it still leaves the MTA without room for much-needed capital investments.
In contrast, even at a 20 or 25x EBITDA multiple (well below average U.S. transactions), the MTA A/R yields a respective $10.3 and $12.9 billion in incremental value. That value creation comes from monetization of latent TBTA equity.282The ‘equity’ in public sector entities generally raises some special considerations, for which the literature is limited. In policy literature and practice, most circumstances focus on Value-for-Money, or VfM, analyses and related frameworks.
At present, there is no ‘value’ attributable to TBTA equity exposure. The MTA A/R transaction would unlock it by creating investable equity in the concessionaire SPV. This would also expand the potential investor base, with respect to both institutions283One identified challenge of asset recycling in the U.S. is the transition of tax-exempt assets to taxable. For many investors, however, that is a feature – not a bug. Many institutional investors, such as pensions and endowments are tax-exempt, and thus disincentivized from infrastructure packaged through tax-exempt bonds.
and geography284Tax treatment also largely circumscribes the investor base to New York in-state residents. However, other parties – particularly liability-driven investors in negative rate environments – may value TBTA cash flows more highly, creating integrative value.
.
The elegance of the transaction is further reinforced by market dynamics: there is an insatiable demand for yield, and $300 billion of infrastructure-specific ‘dry powder’ and sector capital estimated to grow to $1.87 trillion by 2026.285Gill Plimmer et al., Infrastructure Funds Amass 0Bn Ahead of Expected Post-Crisis Boom, Fin. Times (Aug. 15, 2021), https://www.ft.com/content/b00cb6b4-a015-493f-8cf6-ddc89e93ff34 (“Infrastructure investors sitting on more than 0bn of unspent private capital are hopeful that a post-pandemic boost in government spending led by US president Joe Biden’s tn infrastructure package will drive global opportunities in telecoms, toll roads, clean energy and water projects”).
By supplying exactly what the market wants – a marquee infrastructure asset with high, consistent and stress-tested cash flows – the MTA would be able to command a premium while offering a uniquely compelling value proposition to a broadened investor base.286“Investors in European junk bonds have begun accepting interest payments that are lower than eurozone inflation levels for the first time ever, in the latest sign that central banks’ crisis-era debt purchases have shifted the balance between risk and reward.” Naomi Rovnick & Martin Arnold, Real Yields on European Junk Bonds Go Negative for the First Time, Fin. Times (Sept. 7, 2021), https://www.ft.com/content/9110c6a8-69f6-4cc0-9ec5-bad5daeacfb7.
2. Rationalizes Structure & Capital Strategy
At present, the MTA houses two fundamentally different businesses with minimal economies of scale or scope, and seemingly no clear synergies warranting keeping them together.287In the corporate context, this would be a ‘conglomerate,’ with an often-corresponding discount.
Indeed, the primary linkage between the TBTA and the Transit System is the second lien on TBTA cash flows supporting the TRB obligations.288See Metro. Transp. Auth., MTA Flow of Funds 1 (2019), http://web.mta.info/mta/investor/pdf/2018/Flow_of_Funds.pdf.
The contractual structure and capitalization of the MTA group makes a separation of TBTA assets feasible. The MTA and TBTA are operationally and legally separate entities, as the TBTA is an affiliate rather than a subsidiary of the MTA. They are also separately capitalized.289See Figure 6.
The TBTA already subsidizes the NYCT but does so in a relatively financially inefficient manner. Instead of making annual payments through TBTA excess funds, the P3 transaction would simply bring forward those cash flows by monetizing otherwise “latent equity,”290As used here, this term refers to potentially valuable equity value that is effectively “latent” notwithstanding potential financial value.
taking out the MTA Group’s debt and savings billions in annual debt service costs.291If the TBTA Concession proceeds are insufficient to repay all of the TRBs, the remaining bonds may require consideration for surrendering TBTA credit support, which could be achieved through a consent payment. At the same time, the MTA would not be unwise to only pursue a concession at a valuation sufficient to repay all of its debt (about 30x EBITDA), precluding any transition payments to residual TRB investors.
This has the additional benefit of temporally aligning the MTA’s revenues and liabilities. At present, the MTA has extensive unfunded climate liabilities that risk swelling if not addressed. With the caveat of commercial best practices in monetization and reinvestment being essential,292See infra Part IV (discussing best practices and considerations).
given the circumstances, bringing forward the TBTA Concession payment is valuable because the MTA’s problems are very much in the present.
3. Distinct from a Sale or ‘Privatization’
A concession is also meaningfully distinct from either a sale or privatization. Some scholars have argued that long-term concessions effectively represent a sale akin to full privatization because, amongst other considerations, the asset’s useful may fully depreciate by the time the government regains control.293Celeste Pagano, Proceed with Caution: Avoiding Hazards in Toll Road Privatizations, 83 St. John’s L. Rev. 351, 363 (2009).
While the economics of a long-term concession can indeed mirror that of a sale, two distinctions are relevant for our purposes.294This is largely because over a sufficiently long horizon, the value of discounted cash flows asymptotically approaches zero; the concession value, in turn, approaches a perpetuity.
First, the physical asset encompasses a limited portion of the TBTA’s true value; the real economics stem from title and ownership to a natural monopoly.295Even the much-criticized Chicago transaction retained asset title. See, e.g., Auth. of the City Council of the City of Chicago, Authorization for Execution of Concession and Lease Agreement and Amendment of Titles 2, 3, 9, and 10 of Municipal Code of Chicago in Connection with Chicago Metered Parking System 49 (2008) (“No interest in real estate of any kind (whether in the form of ownership, leasehold interest or otherwise) is conveyed by this Agreement.”).
For instance, the TBTA’s capital assets are marked around $6.6 billion, representing at most 15-20% of the concession value. If asset is at the end of its useful life by the end of the contract, the MTA could simply enter into a greenfield concession for a private entity to develop and manage replacement assets, earning itself a replacement revenue stream.296Though beyond the scope of this Article, the issue may also be partially addressed through robust maintenance oversight.
Second, and most importantly, a concession allows for bespoke contractual structuring with embedded optionality to an extent not feasible in a sale transaction, as discussed below.297See infra note 314.
Following a sale, the primary ‘checks’ would be regulatory – which can be effective – though more significant actions could implicate constitutional considerations, including ‘takings’ issues.298See infra Part IV.
Some commentators have suggested a ‘traditional’ privatization of the Transit System to resolve the MTA’s financial challenges.299Scott Beyer, Is It Time to Privatize New York City’s Subways? Catalyst (Nov. 6, 2019), https://catalyst.independent.org/2019/11/06/is-it-time-to-privatize-new-york-citys-subways.
While effective in other jurisdiction – such as Japan, which is pursuing an IPO of the Tokyo Metro – the approach would not work for New York, implicating significant commercial and policy issues, while offering few benefits.300Earlier in 2021, Japan approved an IPO of Tokyo Metro Co, which operates nine subway lines in the city, with proceeds earmarked for government debt repayment. Gearoid Reidy & Emi Urabe, Japan Gives Nod to Future IPO of Massive Tokyo Subway Operator, Bloomberg (July 15, 2021, 10:02 PM), https://www.bloomberg.com/news/articles/2021-07-15/japan-gives-nod-to-future-ipo-of-massive-tokyo-subway-operator.
Commercially, the Transit System, and NYCT in particular, is unlikely to be particularly attractive for investors. The economic value of the TBTA stems from its stable EBITDA and significant free cash flow; the Transit System offers neither. Further, while the TBTA is operationally not dissimilar to commercial real estate301This is largely due to system-wide adoption of EZ-Pass, automating day-to-day functions while increasing collection rates.
, the Transit System is a complex enterprise with tens of thousands of employees.
More importantly, a Transit System privatization would raise serious policy concerns. The Transit System is part of the socio-cultural fabric of New York City. It also closely interplays with core police powers and regulatory functions, including coordination with law enforcement.302See supra Part II.A.
Further, the Transit System reduces negative externalities, which is difficult for the private sector to internalize.
Indeed, a core rationale for the MTA A/R is to resolve the MTA Group’s financial challenges to ensure a ‘fresh start’ through which the MTA has the wherewithal to develop and finance a world-class transportation system for the future – and the public good. Notably, in contrast to the MTA, other jurisdictions, such as Japan, have privately-owned transit systems.
IV. Policy Implications & Considerations
This final Part of the Article discusses normative considerations and policy implications raised by the earlier analyses, while identifying areas for future research.
A. Principles for ‘Hybrid’ Models
As the MTA proposal illustrates,303See supra Part III.
asset recycling, and ‘hybrid’ models more broadly, offer a vast opportunity – estimated at over $1 trillion in the aggregate.304See supra notes109-12.
Leveraging our stock of existing infrastructure to finance the development of new assets can create a virtuous cycle that alleviates the infrastructure investment gap – helping mitigate climate change and build a sustainable economy for the future.
However, deployment of asset recycling must be thoughtful and disciplined. The strategy can work well for certain assets; for others, it may be inapposite, perhaps even counterproductive. This is well illustrated by a contrast between the TBTA and Transit System. The TBTA is a highly-mature, cash-flowing asset with limited operations, and largely removed from much discernable ‘public purpose’; it does not need to be owned by the government. The NYCT, in contrast, likely should be in public hands; it is integral to core governmental functions – including public safety and substantive policy.305Michelle Kaske, NYC Begins Plan To Move Homeless From Subway As Crime Surges, Bloomberg, (Feb. 22, 2022, 4:45 PM), https://www.bloomberg.com/news/articles/2022-02-22/nyc-begins-plan-to-move-homeless-from-subways-amid-crime-wave; see also Off. of the MTA Inspector Gen., 2021 Annual Report, 22 (2021).
That contrast helps illustrate some guiding principles regarding asset selection. First, the transaction has to provide integrative value creation – in other words, a payoff profile that results in a better aggregate outcome than the alternatives. For instance, while as some have pointed out, a transaction for profitable MTA assets decreases future years’ cross-subsidy cash flows, monetizing the TBTA’s otherwise-latent equity provides upfront net present value in excess of those cash flows: a quintessential accretive solution.306Nicole Gelinas, The Public Pays for It, Even if Private Investors Build It, N.Y. Times (Apr. 8, 2015, 6:47 AM), https://www.nytimes.com/roomfordebate/2015/04/08/does-the-public-benefit-from-private-infrastructure-investment/the-public-pays-for-it-even-if-private-investors-build-it.
Second, asset selection must be mindful of externalities. Certain asset types are likely better suited for private sector participation, particularly mature infrastructure with limited potential to reduce negative externalities, which represents an area of divergent incentives between the public and private sectors. Finally, assets closer to ‘core’ governmental powers – like the Transit System – are less likely to be viable candidates for ‘hybrid’ models. From that vantage point, our prevailing approach raises some normative inconsistency. Privately-run prisons and emergency services, for instance, appear incompatible with this framework.307See Schultz, supra note 48, at 205, 224; see also, Dave Hendricks, Hidalgo County EMS May Shut Down Next Week, Progress Times, (May 14, 2021), https://www.progresstimes.net/2021/05/14/hidalgo-county-ems-may-shut-down-next-week (describing likely liquidation of privately-run exclusive emergency service provider for parts of South Texas, following alleged improprieties by owner).
Subsequently, once a potential asset has been selected, it is essential to follow governance and communications best-practices. Along with thoughtful, comprehensive public disclosures, the public sector entity should also maximize engagement, with any transaction subject to robust debate and public comment, with an open-mindedness towards incorporating changes.308See supra Part III.A.
Furthermore, as the assets are held in trust for the public welfare decisions must be subject to robust democratic processes, including, if applicable under respective state law, public referendums.
From a fiscal and process perspective, a structural risk – illustrated by less successful transactions309Robert Channick, Chicago Drivers Pursue Class-Action Lawsuit Against Chiacgo Parking Meters Over ‘75-Year Monopoly’ Granted By City, Chicago Tribune (June 25, 2021, 1:22PM), https://www.chicagotribune.com/business/ct-biz-chicago-parking-meters-lawsuit-20210624-ztjgnwa77jbbvos75vovw4dyi4-story.html.
– is the government being a “forced seller.” In other words, budget considerations should not drive short-sighted decisions on long-term agreements – asset recycling is intended to generate funds for infrastructure, not operating budgets.310This was one of the critical issues identified in respect of the Chicago parking transaction.
Optimizing the transaction structure also necessitates discipline; the MTA, for instance, would not be unwise to reject any TBTA Concession insufficient to repay a large majority of outstanding debt. This can be supported by a robust marketing and auction process facilitated by experienced independent advisers.311See Matthew Goldstein & Patricia Cohen, Public-Private Project Where the Public Pays and Pays, N.Y. Times (June 6, 2017), https://www.nytimes.com/2017/06/06/business/dealbook/trump-infrastructure-plan-privatized-taxpayers.html ( “[P]ublic officials negotiating these arrangements sometimes lack the financial sophistication and advice to fully understand the deals”); Kelsey Hogan, Protecting the Public in Public-Private Partnerships: Strategies for Ensuring Adaptability in Concession Contracts, 2014 Colum. Bus. L. Rev. 420, 424 (2014) (contrasting Indiana and Chicago P3 transactions).
Finally, given the economics of the respective assets – with rates ultimately paid by the public – a transaction must optimize not only the upfront payment, but instead balance consideration with governance rights and rate-setting oversight. Indeed, generating too much upfront is likely to result in ongoing tensions over rates, quality, or concessionaire financial distress. In that regard, the contracting structure is essential — and presents an area ripe for further research, including for instance structures incorporating retained economics coupled with equity ‘ratchets’ triggered based on ESG-specific considerations. As long as the mechanics are effectuated contractually, with ex ante clarity, the approach need not be problematic, but instead could offer an innovative, integrative approach to optimizing inherent trade-offs.312For instance, one could imagine a concession for a 50.1% interest with a ‘ratchet,’ or embedded repurchase option with an ESG metrics-based trigger. Similar provisions exist in credit agreements. This would incentivize the concessionaire to respect stakeholder interests without implicating ‘nationalization’ or ‘takings’ concerns. See Paul J. Davies, Deluge of Debt Is Tied to Carbon Emissions and Diversity, Wall St. J., (May 4, 2021, 7:10 AM) https://www.wsj.com/articles/deluge-of-debt-is-tied-to-carbon-emissions-and-diversity-11620126605 [https://perma.cc/DV43-6GJ9] (describing interest rate ‘ratchets’ tied to ESG metrics in loans).
B. Governance: Nexus Between Public & Private
Our prevailing governance frameworks are well suited for public and private goods, with a rich literature regarding allocations of power between shareholders and managers – the separation of ownership and control.313Some of the most pioneering work goes back the better part of a century. See Adolf A. Berle & Gardiner C. Means, The Modern Corporation and Private Property ix (2d ed., Transaction Publishers 1991) (1932); Lucian A. Bebchuk et al., The Agency Problems of Institutional Investors, 31 J. Econ. Persp. 89, 90 (2017).
Third, with respect to private sector participation, the investor base is not irrelevant. While, aside from geo-political considerations,314Kevin Granville, CFIUS, Powerful and Unseen, Is a Gatekeeper on Major Deals, N.Y. Times, (Mar. 5, 2018), https://www.nytimes.com/2018/03/05/business/what-is-cfius.html.
a significant amount of the allocation may be left for market mechanisms, some policy considerations remain. Certain stakeholders may have greater normative alignment with broader policy goals – such as pension funds, in particular.315Devitt, supra note 79 (noting “[p]ensions are very friendly investors for infrastructure” with the potential to create a “virtuous circle” between the two sectors).
While we may be ill-served by investment mandates, policy also should not disincentivize participation by such investors.316 U.S. Gov’t Accountability Off., supra note 79, at 2 (describing why tax treatment disincentivizes pension funds from infrastructure investments).
In that regard, asset recycling offers value by transitioning assets to a taxable structure that can allow tax-exempt asset managers to consider the investments on an apples-to-apples basis.
Finally, the optimal frameworks must put sustainability first, particularly with a focus on externalities – internalizing the negative, and incentivizing the positive. From that perspective, multi-stakeholder models could add value by having a broader range of impacted parties ‘at the table,’ providing voice to considerations and constituencies that are, all too often, not heard in the respect of matters impacting them the most.
C. Infrastructure Policy & Climate Change
Climate change and infrastructure are deeply intertwined. Without appropriate shared resources, it is difficult to overcome a crisis of externalities, aptly termed a ‘tragedy of the horizons.317Mark Carney, Governor of the Bank of England and Chairman of the Financial Stability Board, Speech at Lloyd’s of London (Sept. 29, 2015), https://www.bis.org/review/r151009a.pdf.
This Article raises a number of considerations with respect to the optimal corresponding policy mix– particularly from the perspective of allocative equity with respect to costs and risks.
In many ways, it comes back to divisions of labor and responsibility – first as between the private and public sectors,318See supra Parts I.B.2, IV.B.
then between levels of government,319See supra Part I.B.3.
and ultimately, amongst individuals with an emphasis on social equity.320See Breydo, supra note 8, at 1084.
With respect to the public-private interplay, as discussed above, the critical takeaway is that more private sector involvement may be beneficial, subject to appropriate safeguards. Further, while private capital can fill gaps, it is the government that must ultimately drive.
From that vantage point, a larger federal role in infrastructure policy may be logical – perhaps overdue – arguably warranting a transition away from the traditional federalist delegation of infrastructure responsibility to the states. The federal government has a structurally lower cost of capital with broader market access, incentives to look beyond state borders,321See supra notes 67-69.
and is ultimately responsible for coordination with other nations.322Press Release, Joe Biden, President, Biden Statement on Paris Climate Agreement (Jan. 20, 2021), https://www.whitehouse.gov/briefing-room/statements-releases/2021/01/20/paris-climate-agreement [https://perma.cc/4GZY-8UXK].
However, the state and local expertise should not be ignored, particularly with respect to asset selection and project implementation.323See supra Parts I.C.3, 4.
Finally, policy must be mindful of the deep underlying inequities of wealth, income and power that plague America. Thus, we must ensure that policy is not functionally creating regressive taxes, such as rate increases for natural monopoly assets.324See supra Part II.B.1.
Equity, from both an allocative and socio-economic justice perspective, must be at the heart of infrastructure policy.
Conclusion
Infrastructure is an essential “shared means to many ends.”325See supra note 16.
Yet, the ‘market’ for it exhibits pervasive disequilibria – with a $2.6 trillion funding gap – impairing our economy, quality of life and ability to address climate change. The disequilibrium goes beyond politics, driven by a combination of infrastructure’s unique economic attributes, and distinctive features of the U.S. system, including a public sector-centric framework and federalist delegation of infrastructure responsibility to the states.
Other countries take very different approaches, driving better outcomes – and illustrating that there is more than one option. Based on a holistic, global analytical framework this article proposes asset recycling as a solution, illustrated through the MTA case study.
The MTA is used, in part, because of its scale – with over $50 billion of debt, a long-delayed $51.5 billion climate investment program and ‘no bankruptcy’ bond covenants – but mainly because it reflects broader issues plaguing infrastructure policy nationwide. Transit systems in Boston, Chicago, Washington and San Francisco are burdened by eerily similar challenges. Our electric grid is “increasingly unreliable”; Flint’s water poisoned a generation of children.326See supra note 12.
Asset recycling offers an extremely attractive solution for the MTA’s financial woes, with potential to repay the majority of its debts, freeing up resources to build the sustainable infrastructure New York deserves.
Beyond the mechanics and empirics, the underlying principles – leveraging existing assets to engage private capital, coupled with robust oversight – have implications well beyond the MTA, while the magnitude of the challenges reinforces the necessity of innovative solutions.
Appendix
Appendix I. Detailed MTA Financials

Appendix II. MTA Organization & Component Units
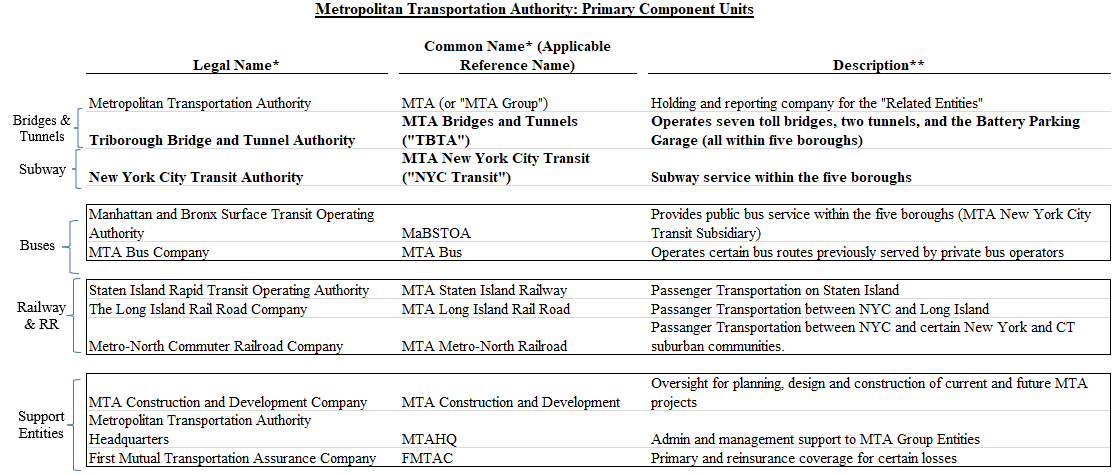
Appendix III. MTA Capital Structure (Q4 2021)
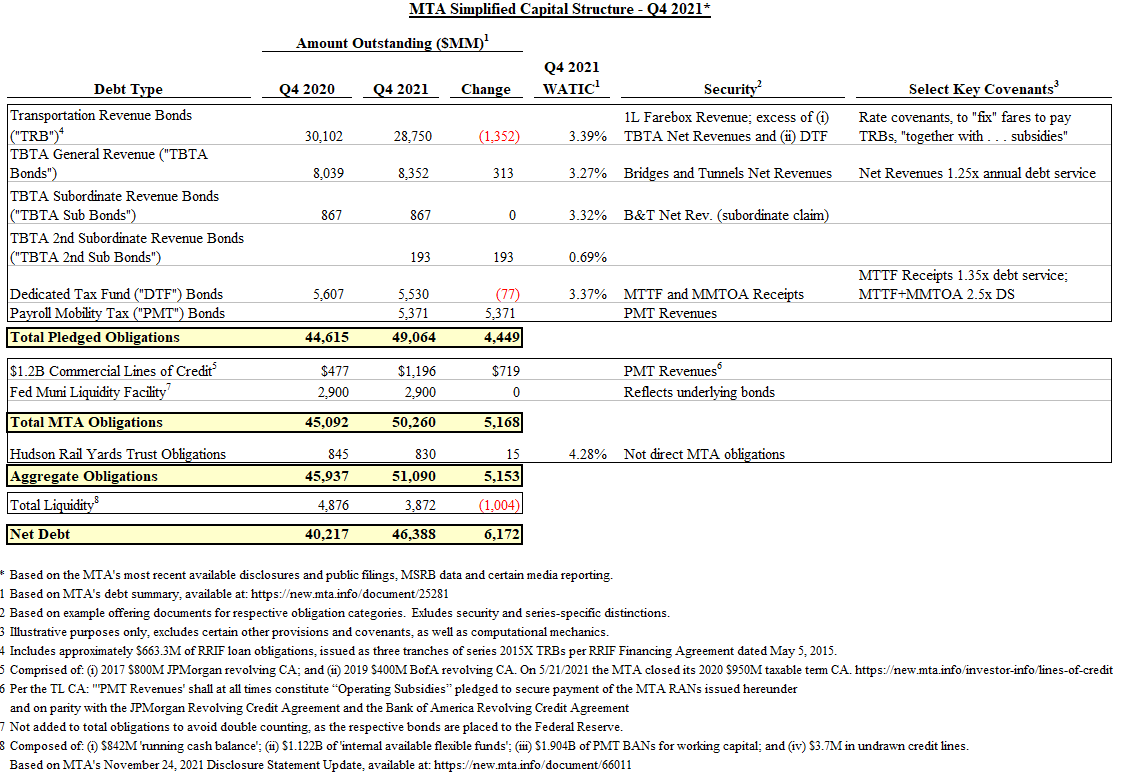
* Assistant Professor, William & Mary Law School; Affiliated Professor, William & Mary Mason School of Business; Faculty Fellow, William & Mary Center for the Study of Law and Markets. For helpful input and feedback, I am grateful to Brett Frischmann, Teresa Ravenell, Todd Aagaard, Andrew Lund, Edward Greene, Robert Poole, Chaim Saiman, William Organek, Steven Xie and Daniel Rosenblum, as well as all participants at Villanova faculty workshops. Ana Blanco and Andrew Schwartz provided excellent research assistance. The Journal of Law and Mobility has offered exceptional insights and suggestions through the course of the peer-review process. All errors and omissions are my own.
+ As detailed further alongside the respective discussions, it is critical to note that the primary analyses in this Article are as of late 2021 (when this research was conducted). The Article thus does not reflect changes and subsequent developments, including with respect to prevailing interest rates, financing terms or term structure, as well as legislative and policy developments. Correspondingly, the results of certain analyses may differ today based on evolving interest rate conditions and assumptions which are subject to change, as detailed further in the Article.